 Previewing a Report
To preview a report to the screen, click the Preview button. You can click this button any time after you have chosen a report. You can also double-click the report in the list, choose Preview from the File menu, or right-click and choose Preview from the shortcut menu.
While the report runs, the Reports Explorer and any open report wizards turn dim and a progress window appears. At any point during the report run, you can stop the report by pressing the Esc key or clicking the Cancel button (be patient; if the report is in the middle of retrieving records from the database, it may take a few seconds to stop the report). The progress window displays the following messages:
Running report: this message displays as the report layout is being finalized.
If there are any ask at runtime filter conditions for the report, a dialog appears asking you to specify the values for those conditions. If you run a batch report, you are asked for all unique conditions for all reports in the batch; that way, you aren't asked more than once for the same value. If you click Cancel in this dialog, the report stops.
Selecting records: this message displays while the records to appear in the report are selected from the total set of records in the database. If records with invalid date values are found, Stonefield Query prompts whether you wish to see these records; see the Handling Invalid Dates topic for details. The report does not continue in this case.
<n> records selected: this message displays for a few seconds after the records have been selected, indicating the number of records selected. If no records were found that match the specified filter, one of two things happens:
If you turned on the Run report with no records option on the Options page, the report continues to run and a blank report is output.
If you turned that option off, a message that there are no records displays and the report is not output.
Processing records: this message displays while the records selected for the report are processed so they are formatted properly for the report.
<n> records processed: this message displays for a few seconds after the records have been processed.
Running report; press Esc to cancel...: this message displays while the report pages are queued for display in the Preview window and a progress meter displays the progress of the output.
The report then appears in the Preview window, which can be moved or sized as desired. You can also scroll in this window to see other parts of the report.
There are actual several different Preview windows, depending on the type of report you run: the Dashboard Preview window is used for dashboards, the Chart Preview window is used for charts, the Gauge Preview window is used for gauges, the Crystal Preview window is used for Crystal reports, and the Report Preview window is used for all other types of reports.
Having the Preview window open doesn't prevent you from doing other operations, such as previewing another report. If the Preview reports in tabbed pages setting in the Options dialog is turned on and the Preview window is already open, the report appears in another tab in the Preview window. If that setting is turned off, the report appears in a new Preview window. This means you can preview two different reports and put the Preview windows side-by-side or click on the report tabs to compare them. You can even run the same report a second time with different values for ask-at-runtime filter conditions, such as a different date range, and compare the two results.
If you preview more than one chart or gauge at a time, each report appears in a tab of the Chart or Gauge Preview windows regardless of the Preview reports in tabbed pages setting.
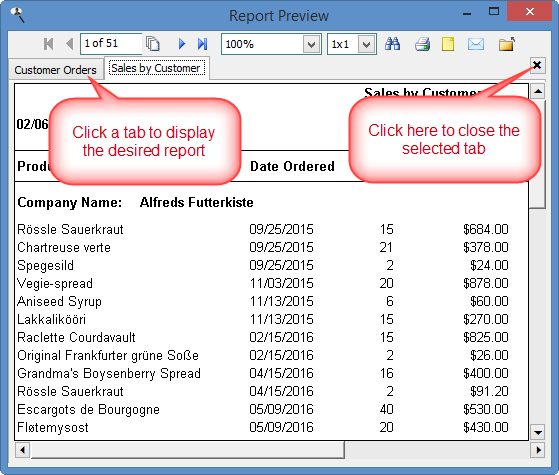
If several reports are shown in their own tabs in one Preview window, click the tab to display the desired report. To close the selected tab, click the button with the black X in the upper right corner of the Preview window or middle-click (if your mouse has a middle button or a wheel) in the tab.
At the left of the Preview window is a panel that can be expanded or collapsed by clicking the panel bar, which has ">" to indicate clicking expands or "<" to indicate clicking collapses. Three buttons are visible when the panel is expanded:
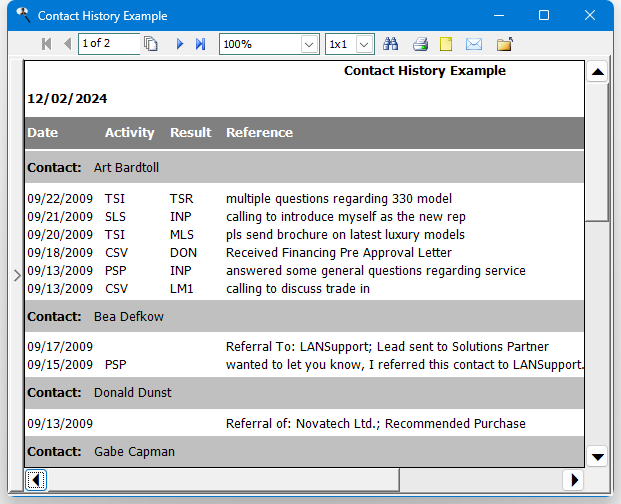
Bookmarks: if one of the fields in the report has the Create bookmarks on this field setting turned on in the Field Properties dialog, the left panel expands to show the Bookmark pane, listing each of the values in that field. Clicking a bookmark moves the preview window to the page where that value appears.
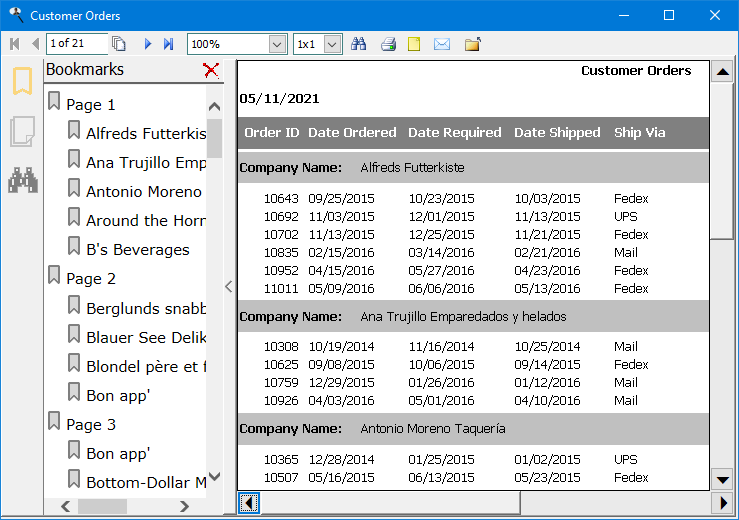
Page Thumbnails: click this button to display report pages as thumbnail images.
Search Results: click this button to display the results of the most recent search.
The Report Preview toolbar provides the following functions:
First page: displays the first page of the report; this button is disabled when the first page is displayed.
Previous page: displays the previous page of the report; this button is disabled when the first page is displayed.
Go to page: displays a dialog in which you can enter the page number to display.
Next page: displays the next page of the report; this button is disabled when the last page is displayed.
Last page: displays the last page of the report; this button is disabled when the last page is displayed.
Zoom: this drop-down list allows you to scale the report to different sizes, from 10% to 6000%. You can also choose Fit in Window, which fits the entire page into the Preview window, or Fit to Width, which adjusts the page so its entire width fits in the Preview window. The Preview window remembers the setting of this option. If you run a report and change Zoom to 200%, the next time you preview a report, it'll be at 200%.
This isn't available in the Chart, Gauge, or Dashboard Preview windows.
Pages to display: allows you to specify how many pages the Preview window displays at a time. The choices are 1x1, which displays a single page at a time in the Preview window, and numerous AxB values, where A is the number of pages per row and B is the number of rows (for example, "4x2" means two rows of four pages each).
This isn't available in the Chart, Gauge, or Dashboard Preview windows.
Find: choose this function to locate text in the report. The Find dialog appears with the following options:
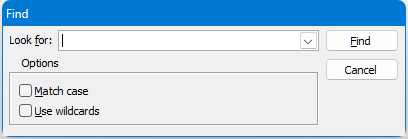
Look for: enter the text to locate. To look for text you previously entered, choose it from the drop-down list.
Match case: if you want to locate text using the exact case you entered (for example, "Test" without matching "test"), turn on this option.
Use wildcards: turn on this option if you want to use wildcards when searching for text.
When you click the Find button in this dialog, the Preview window locates all instances of that text and highlights them in yellow. The Preview window expands the left panel and selects the Search Result pane listing all instances of the found text, including the page number it appears on, with links you can click to jump to that instance. The Close button closes the pane.
This isn't available in the Chart, Gauge, or Dashboard Preview windows.
Print: displays a dialog so you can print the report. This dialog has the following options:
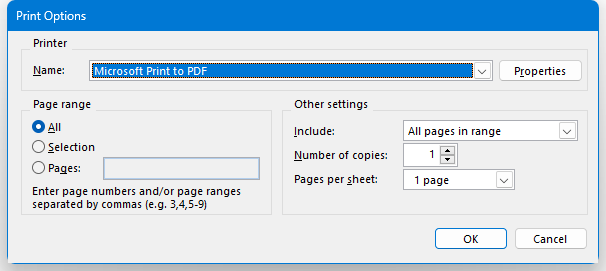
Printer: use this to select the printer to print to.
Properties: click this button to display the properties dialog for the selected printer, which allows you to do things such as changing the selected paper tray or print quality.
Page range: All prints all pages or you can enter a list of page numbers to print, separated by commas. For example, 2, 4, 7-9 prints pages 2, 4, 7, 8, and 9.
Include: this option allows you to specify all pages, even pages only, or odd pages only. The latter two settings are handy when you print a report bound into a book.
Number of copies: the number of copies to print.
Pages per sheet: this option allows you to specify how many report pages are printed on each sheet of paper. For example, "4 pages" means the printer prints four pages of the report, each 1/4 their normal size, on each sheet.
Watermark: display the Watermark Options dialog. See below for information about watermarks.
Output report: displays a dialog so you can output the report to a file. This dialog has the following options:
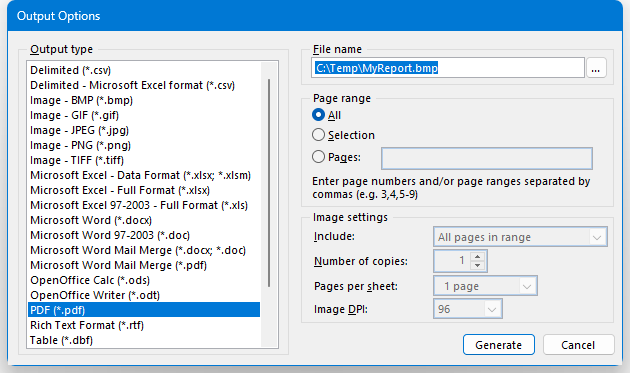
Output type: select the desired output type. The list displays the same set of options available on the Output page of the Reports Explorer.
File name: the name of the file to output to. The file name defaults to the name of the report, the folder defaults to the folder you used last time you output a file, and the extension defaults to the appropriate value for the selected output type; for example, the extension defaults to "doc" if you choose Microsoft Word as the output type.
Page range: All outputs all pages or you can enter a list of page numbers to output, separated by commas. For example, 2, 4, 7-9 outputs pages 2, 4, 7, 8, and 9.
Include: this option allows you to specify all pages, even pages only, or odd pages only. The latter two settings are handy when you output a report bound into a book. This setting is only available when you output to an image file.
Number of copies: the number of copies to output. This setting is only available when you output to an image file.
Pages per sheet: this option allows you to specify how many report pages are output on each page of the image. For example, "4 pages" means the each image page contains four pages of the report, each 1/4 their normal size. This setting is only available when you output to an image file.
Image DPI: the resolution of the image in Dots Per Inch (DPI). This setting is only available when you output to an image file.
Watermark: display the Watermark Options dialog. See below for information about watermarks.
Email report: emails the report. When you click the Email button, a dialog appears with the same options as the Output page of the Reports Explorer.
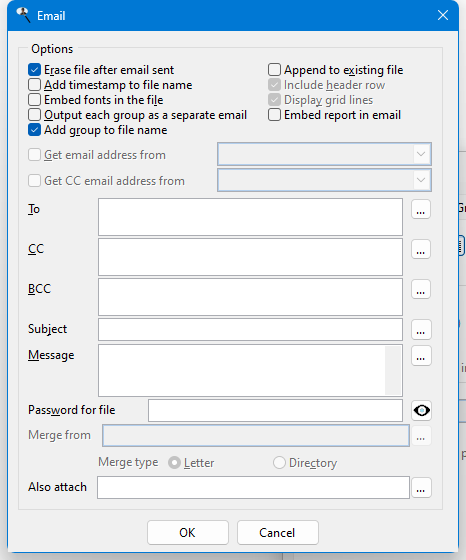
Once you have chosen the desired options, click the OK button. If you did not previously fill in the information in the Email page of the Options dialog, the email cannot be sent. In that case, you are asked if you want to fill that information in now. If so, that page of the Options dialog appears so you can do so and then try to send the email again.
Close: closes the Preview window. You can also click the Close box for the Preview window or press Esc.
If a field in the report is linked, it will appear similar to links in Web pages: underlined and colored either blue (for email or Web links) or green (for report links). Clicking the link takes the appropriate action, such as opening your browser to the appropriate Web page. If the link runs a linked report, it appears in either its own Preview window or the same Preview window in its own tab, depending on the Preview reports in tabbed pages setting in the Options dialog.
If a field in the report has a tooltip, hovering the mouse pointer over a value for that field displays the toolip.
Certain keys can also be used to control the window:
Esc: closes the Preview window.
Right arrow: scrolls toward the right side of the page.
Left arrow: scrolls toward the left side of the page.
Up arrow: scrolls toward the top of the page.
Down arrow: scrolls towards the bottom of the page.
Page Up: moves to the previous page.
Page Down: moves to the next page.
Home: moves to the first page.
End: moves to the last page.
Ctrl-F: displays the Find dialog.
Ctrl-G: displays the Go to Page dialog.
Watermarks
Click the Watermark button in the Print Options or Output Options dialogs to display the Watermark Options dialog. A watermark is an image or text that appears across every page. Here's an example:
Choose Text to use a text watermark or Image to use an image watermark. Both types of watermarks have the following options:
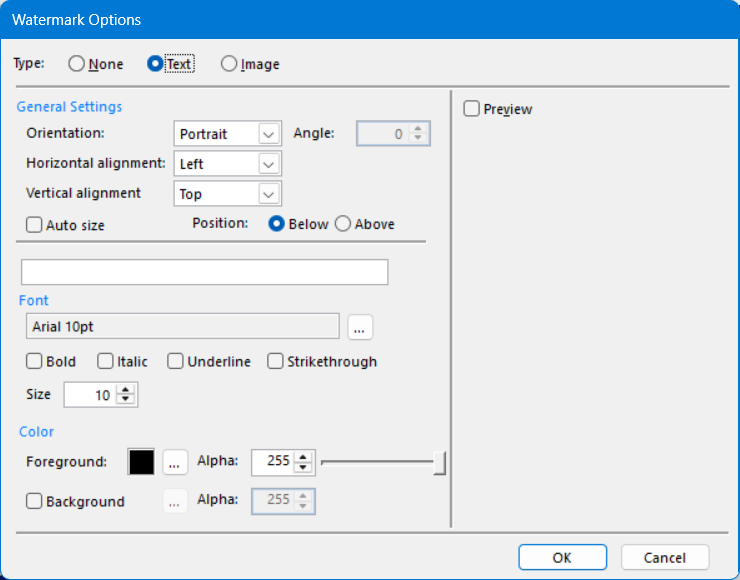
Orientation: choose Portrait to display the watermark in portrait orientation, Landscape to use landscape (that is, rotate it 90 degrees counter-clockwise), Diagonal to place it diagonally (that is, rotate it 45 degrees counter-clockwise), or Rotate to specify a specific rotation using the Angle setting.
Horizontal alignment: choose the horizontal alignment: Left, Center, Right, or Justify.
Vertical alignment: choose the vertical alignment: Top, Middle or Bottom.
Auto size: turn this on the size the watermark so it fits across the page.
Position: choose Below to place the watermark below the report text or Above to place it above.
Preview: turn this on to preview the page with the watermark.
Text watermarks have the following additional options:
The text for the watermark.
Font: click the ... button to select the font name, size, and other settings. You can also use the Bold, Italic, Underline, Strikethrough, and Size settings.
Foreground: click the ... button to select the foreground color for the text. You can also set the transparency of the color using the Alpha setting or the slider.
Background: turn on this setting and click the ... button to select the background color for the text. You can also set the transparency of the color using the Alpha setting or the slider.
Image watermarks have the following additional options:
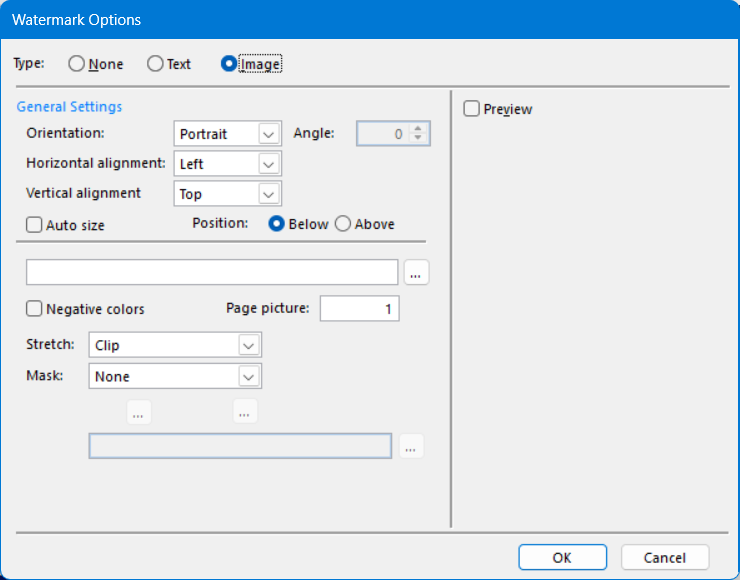
Image: click the ... button to select the image to use.
Negative colors: turn this on to display the image using negative colors.
Page picture: select the page picture to use.
Stretch: choose how to display the image if it doesn't fit: Clip, Stretch, or Fill.
Mask: you can mask the image by choosing Color, Mask Image, or Soft Mask Image. A mask can be a color (a range of two colors), a clipping mask (a black and white image to which the source image is cropped), or an alpha mask (a grayscale image defining transparency at a specific point in the source image).
If you choose Color, select the foreground and background colors by clicking the ... buttons. For Mask Image or Soft Mask Image, select the image to use by clicking the ... button.
© Stonefield Software Inc., 2025 • Updated: 05/28/25
Comment or report problem with topic