 Sample Reports and Labels
Stonefield Query comes with many sample reports and labels. These reports are automatically added to your list of reports the first time you run Stonefield Query. You can delete any you don't wish to use. To re-add a sample report you've deleted, choose the Import function from the File menu, move into the Sample Reports subdirectory of the Stonefield Query program folder, and select the desired report.
The following reports come with Stonefield Query.
Labels
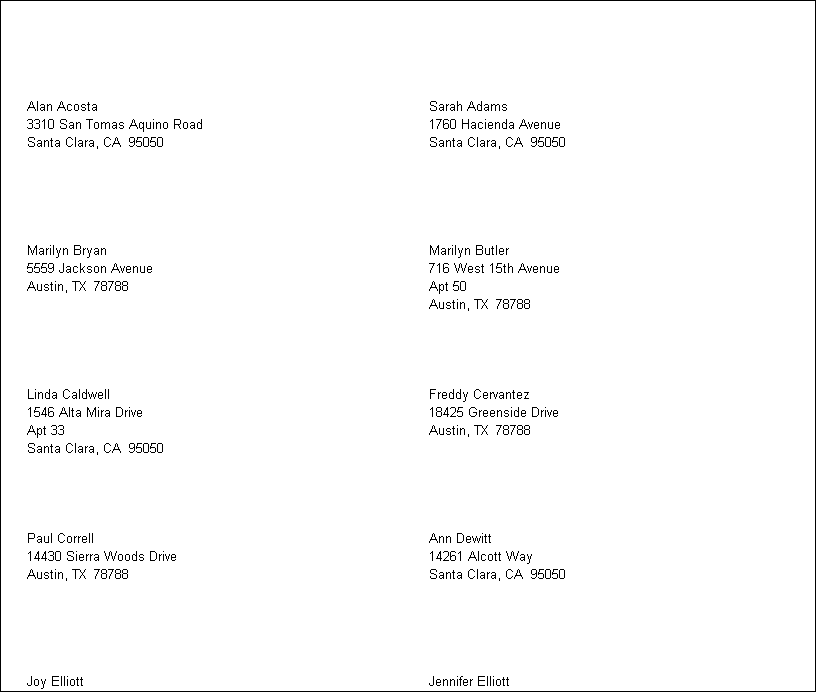
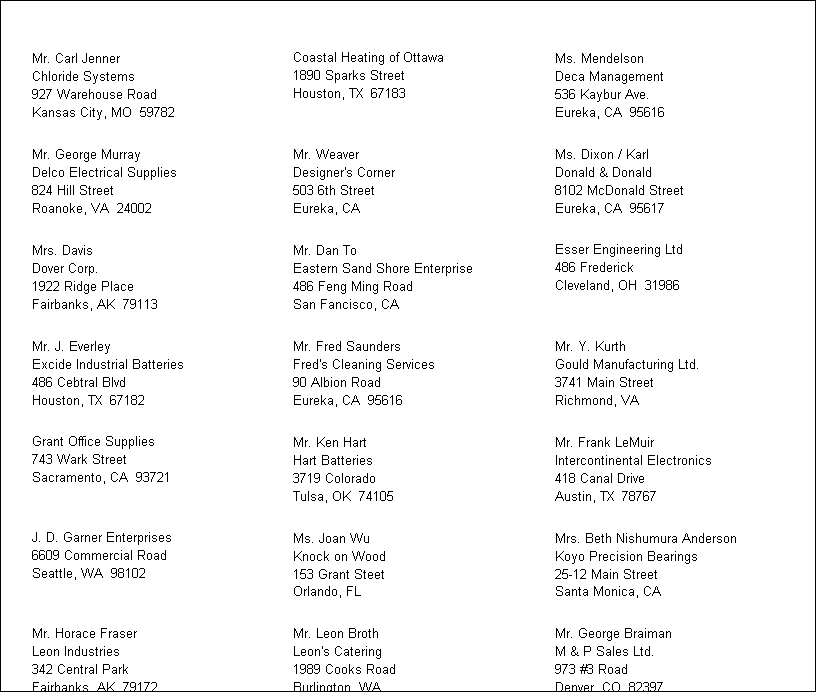
Customers - Full, Company 1st.sfx: labels for Accounts Receivable customers. This label prints all four lines of address, so it requires a 1.5 inch high label, and prints the company name on the first line and the contact name on the second line.
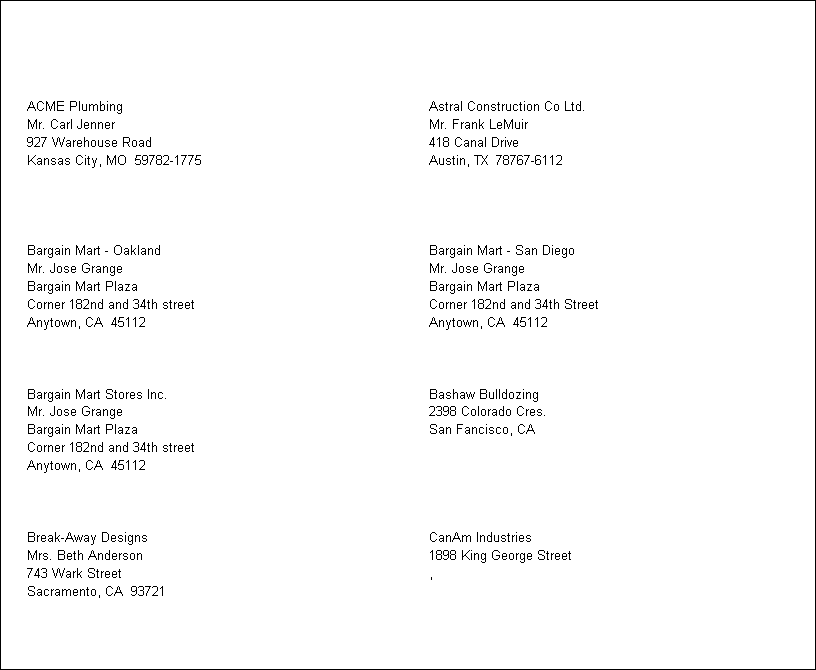
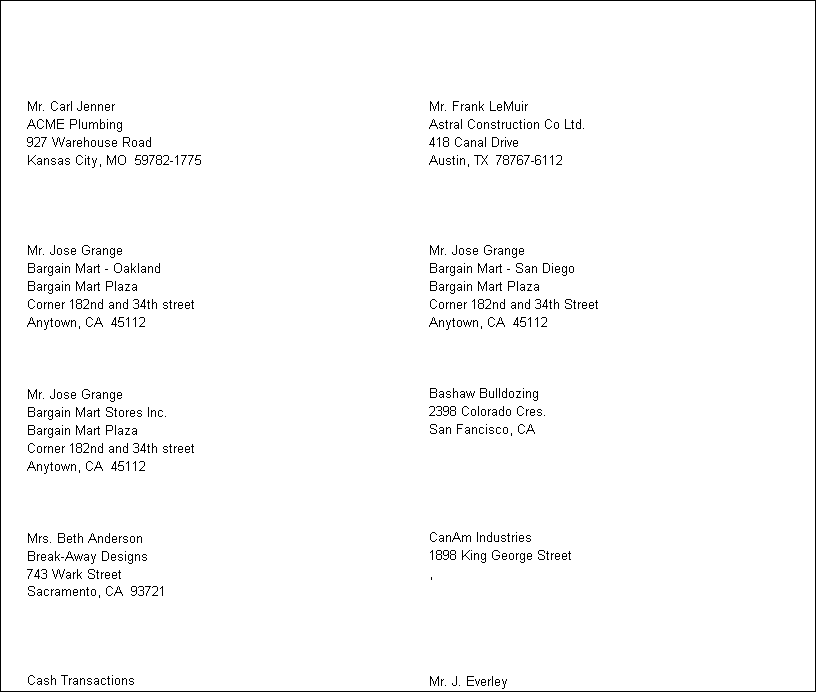
Customers - Full, Contact 1st.sfx: labels for Accounts Receivable customers. This label prints all four lines of address, so it requires a 1.5 inch high label, and prints the contact name on the first line and the company name on the second.
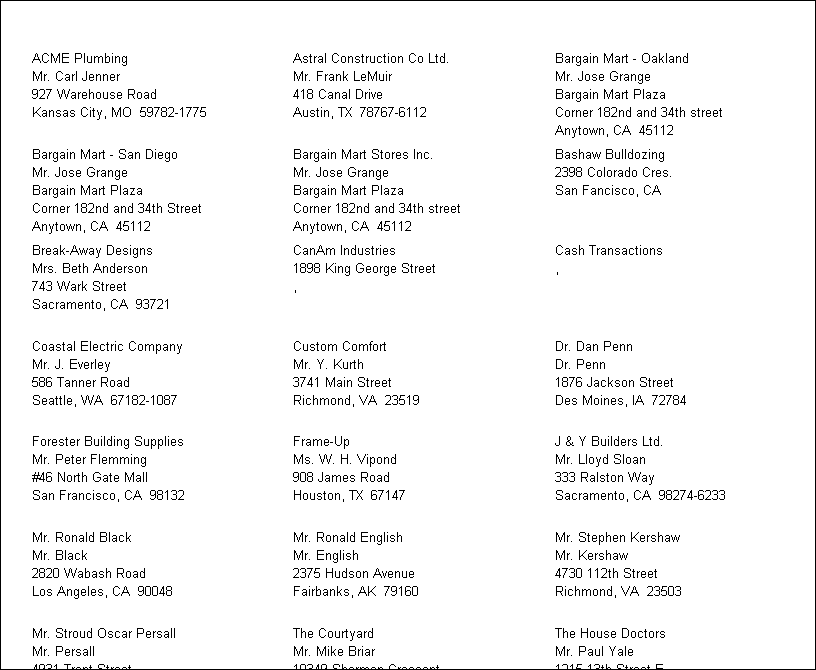
Customers - Short, Company 1st.sfx: labels for Accounts Receivable customers. This label only prints the first two lines of address, so it fits on 1 inch high labels, and prints the company name on the first line and the contact name on the second.
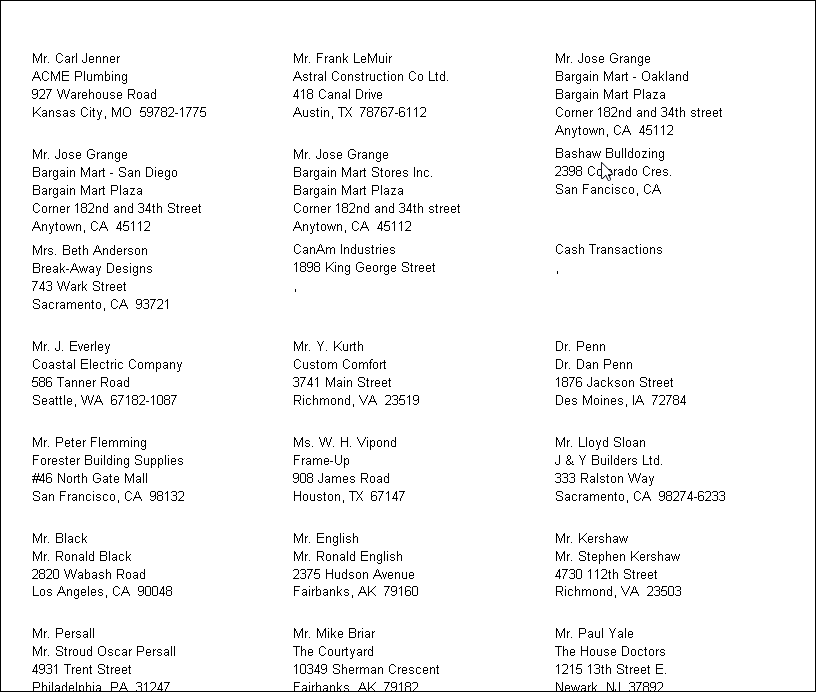
Customers - Short, Contact 1st.sfx: labels for Accounts Receivable customers. This label only prints the first two lines of address, so it fits on 1 inch high labels, and prints the contact name on the first line and the company name on the second.
Employees (Canadian).sfx: labels for Canadian Payroll employees. This only appears if you use Canadian Payroll and it has the same layout as Employees (US).
Employees (US).sfx: labels for U.S. Payroll employees. This only appears if you use U.S. Payroll.
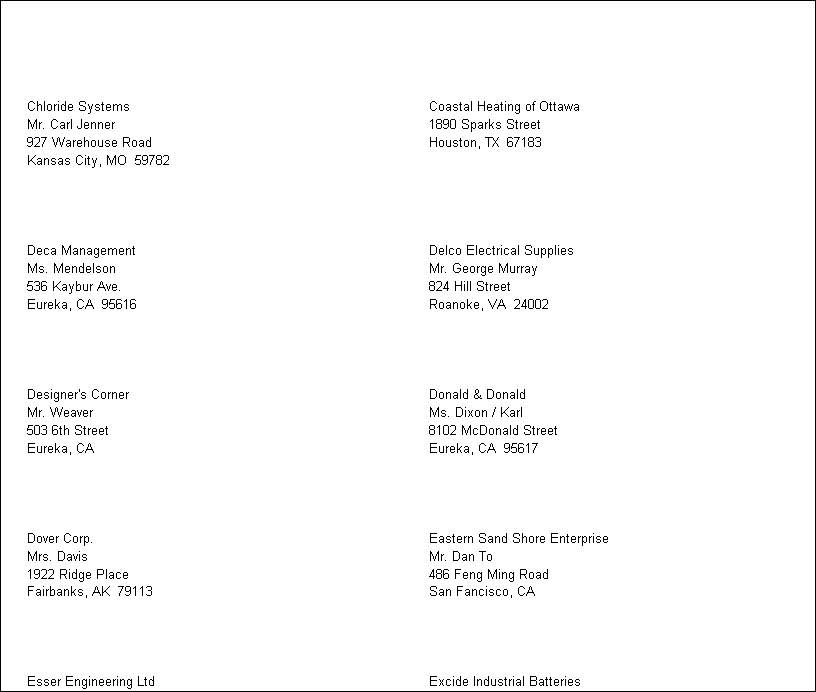
Vendors - Full, Company 1st.sfx: labels for Accounts Payable vendors. This label prints all four lines of address, so it requires a 1.5 inch high label, and prints the company name on the first line and the contact name on the second line.
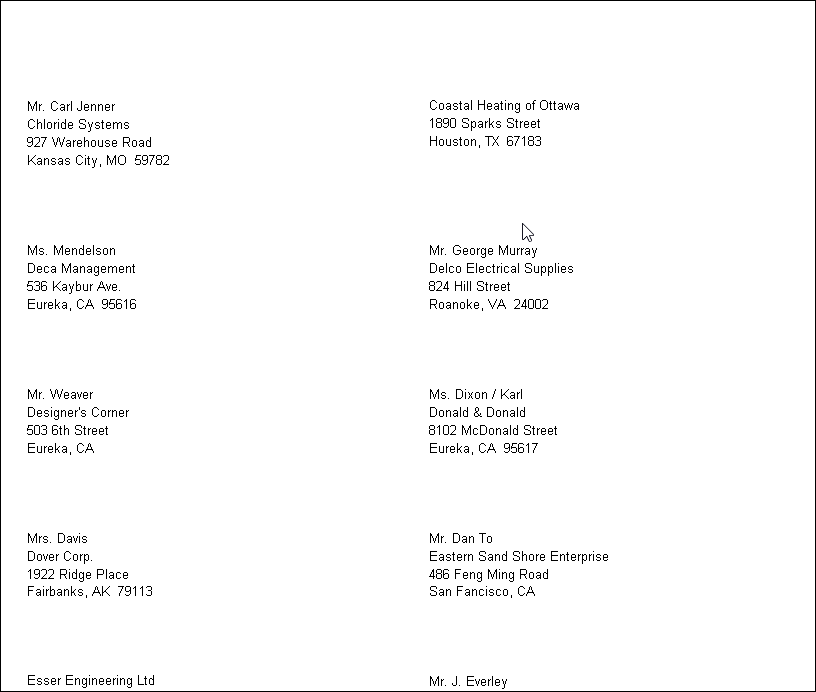
Vendors - Full, Contact 1st.sfx: labels for Accounts Payable vendors. This label prints all four lines of address, so it requires a 1.5 inch high label, and prints the contact name on the first line and the company name on the second.
Vendors - Short, Company 1st.sfx: labels for Accounts Payable vendors. This label only prints the first two lines of address, so it fits on 1 inch high labels, and prints the company name on the first line and the contact name on the second.
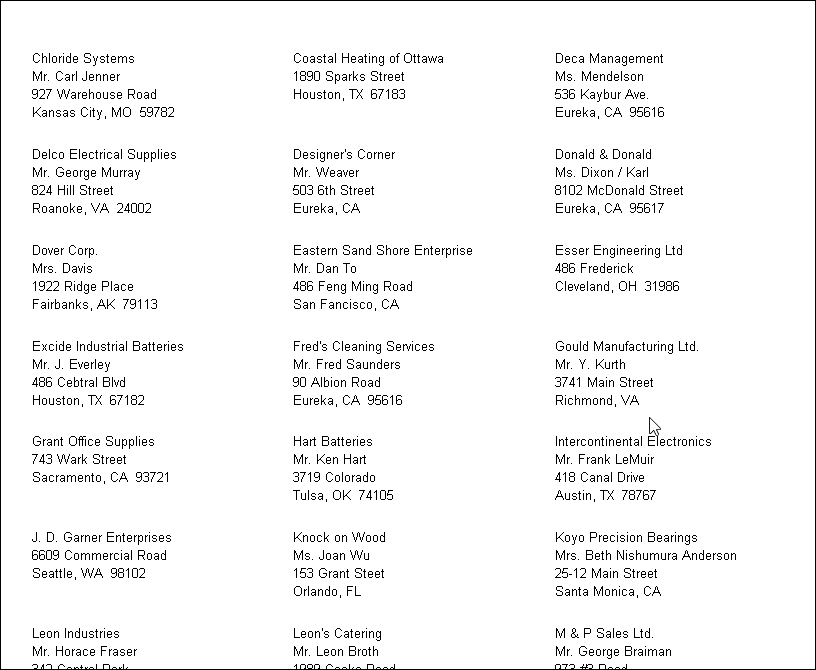
Vendors - Short, Contact 1st.sfx: labels for Accounts Payable vendors. This label only prints the first two lines of address, so it fits on 1 inch high labels, and prints the contact name on the first line and the company name on the second.
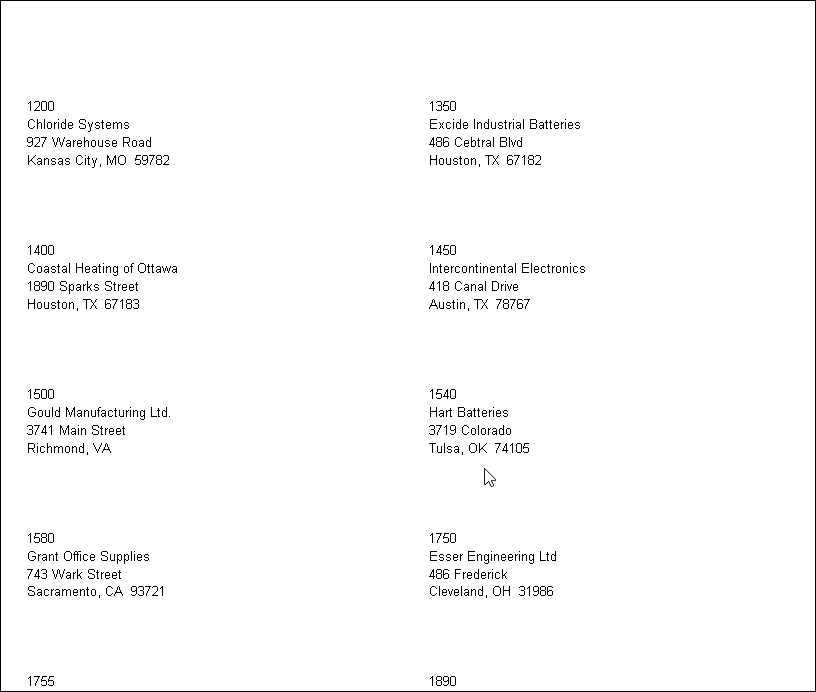
Vendors with Vendor Number.sfx: prints labels for AP vendors with vendor ID on the first line.
You can create other types of labels using the Label Wizard, the Mail Merge features of Microsoft Word or the Advanced Report Designer.
GL Reports
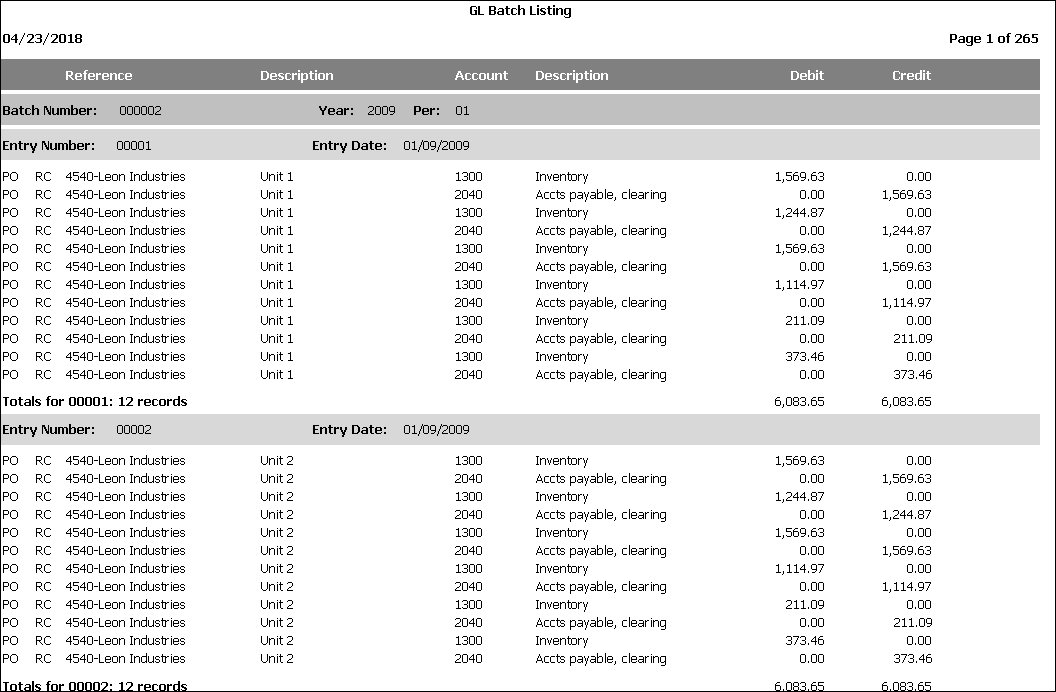
GL Batch Listing.sfx: prints an unposted GL batch listing that shows less information than Sage 300's version.
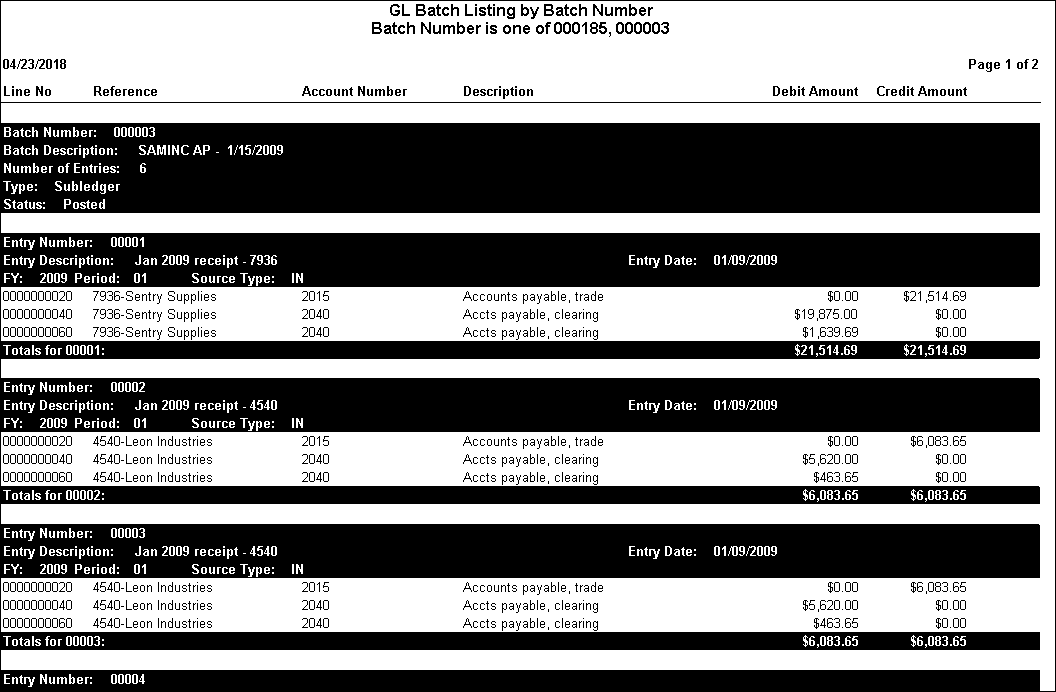
GL Batch Listing by Batch Number.sfx: prints an unposted GL batch listing grouped by batch number.
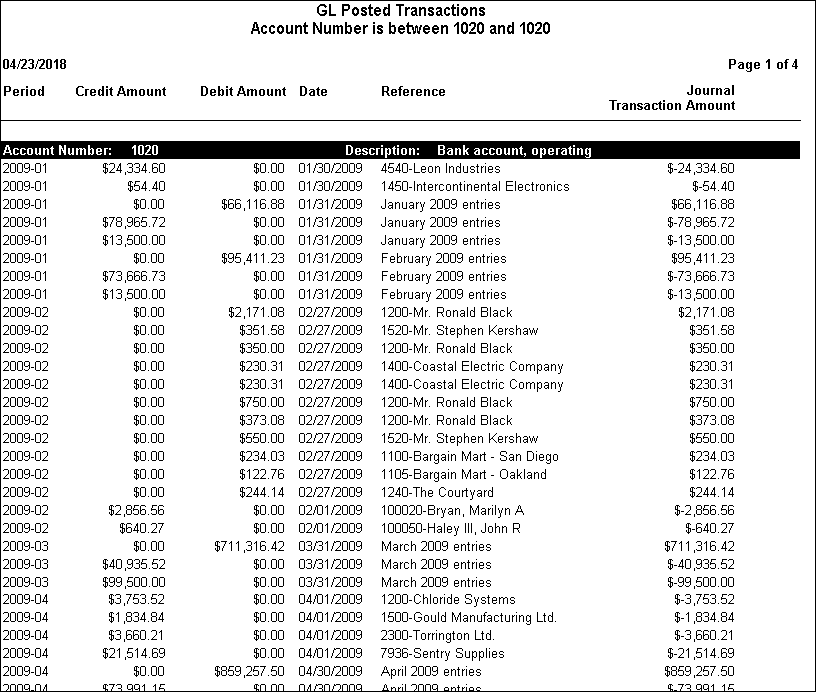
GL Posted Transactions.sfx: This report shows posted GL transations for a range of acccounts in a certain period.
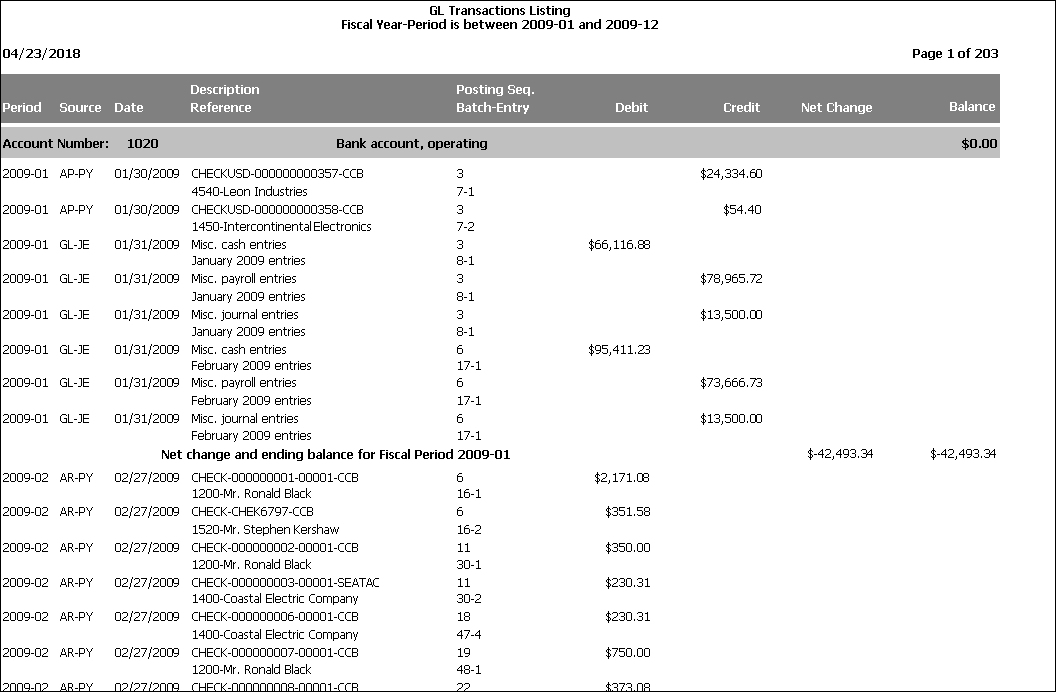
GL Transactions Listing.sfx: this report duplicates the Sage 300 GL Transactions Listing report but allows the report to span fiscal years.
AP Reports
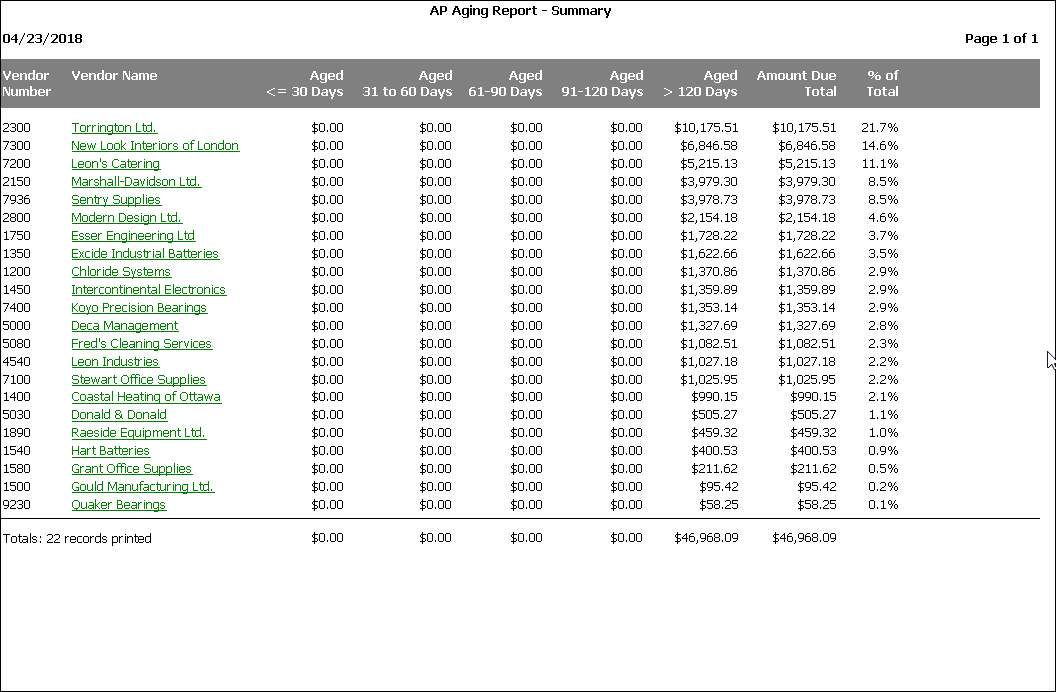
AP Aging Report - Summary.sfx: this shows a summarized AP aging report, with the largest amounts due at the top. Click the vendor name to drill down to see the invoices.
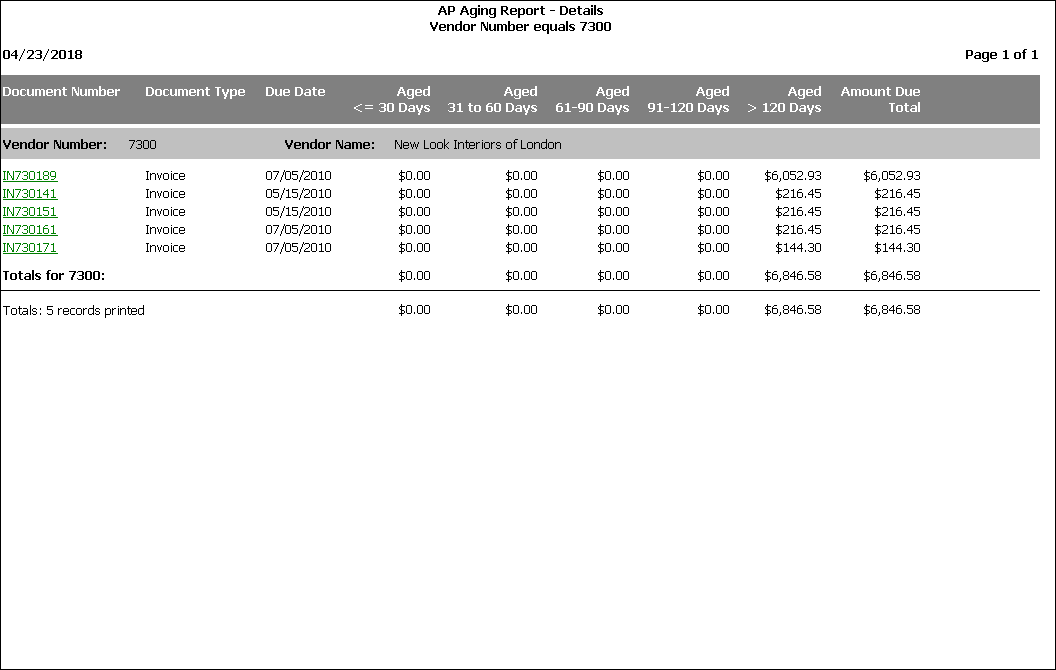
AP Aging Report - Details.sfx: this shows an AP aging report, displays invoices for a specific vendor. Click the invoice number to drill down to see invoice details. It's the drill down report from AP Aging Report - Summary.
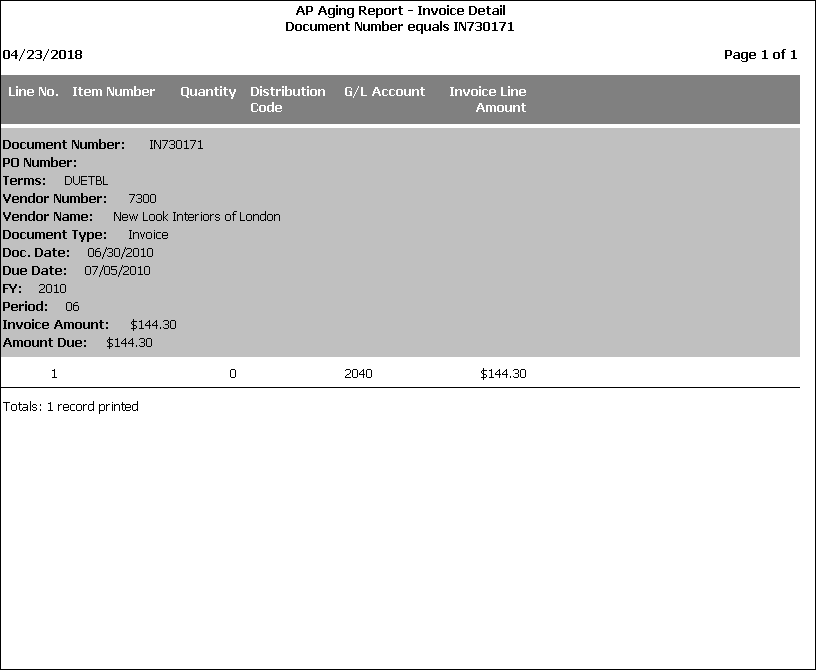
AP Aging Report - Invoice Detail.sfx: this report shows details for a specific invoice. It's used as the drill down from AP Aging Report - Invoice Detail.
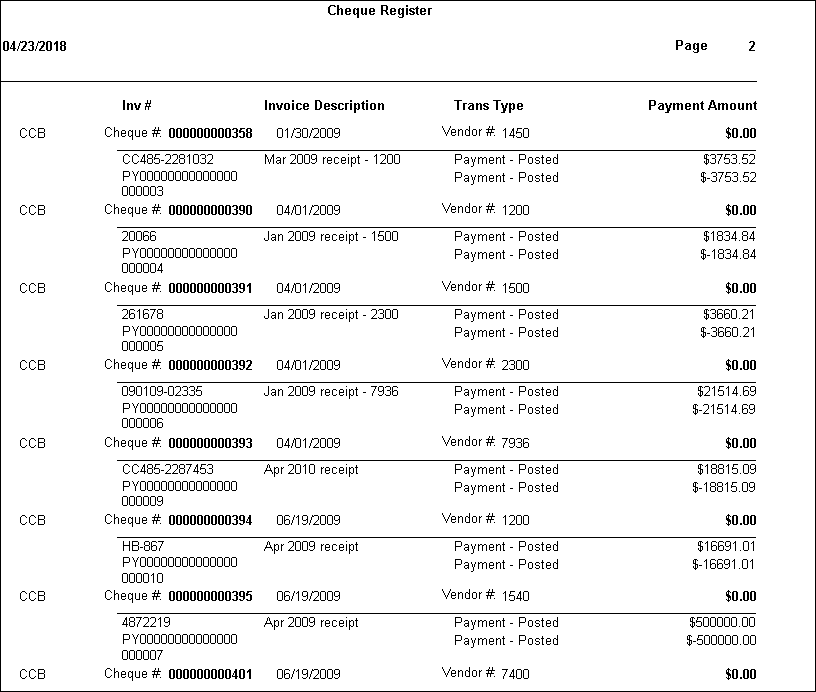
AP Cheque Register.sfx: a list of Accounts Payable checks for a range of check dates showing the invoice number and invoice description. If you print this with "Summary" checked, it shows only the check information without the invoice details.
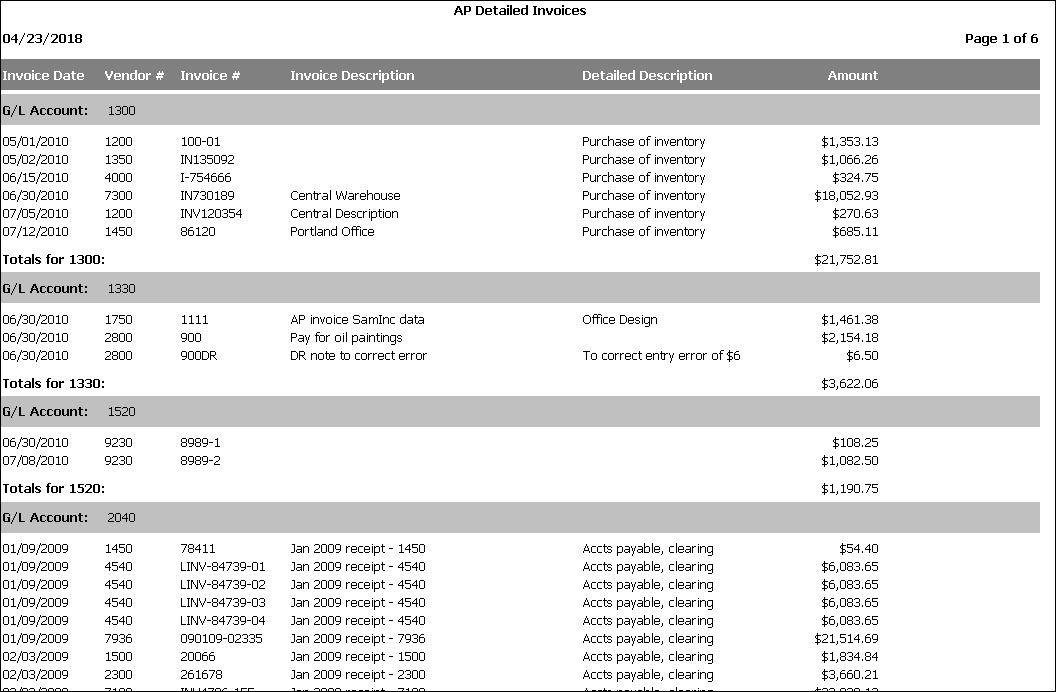
AP Detailed Invoices.sfx: prints Accounts Payable invoice detail grouped by GL account.
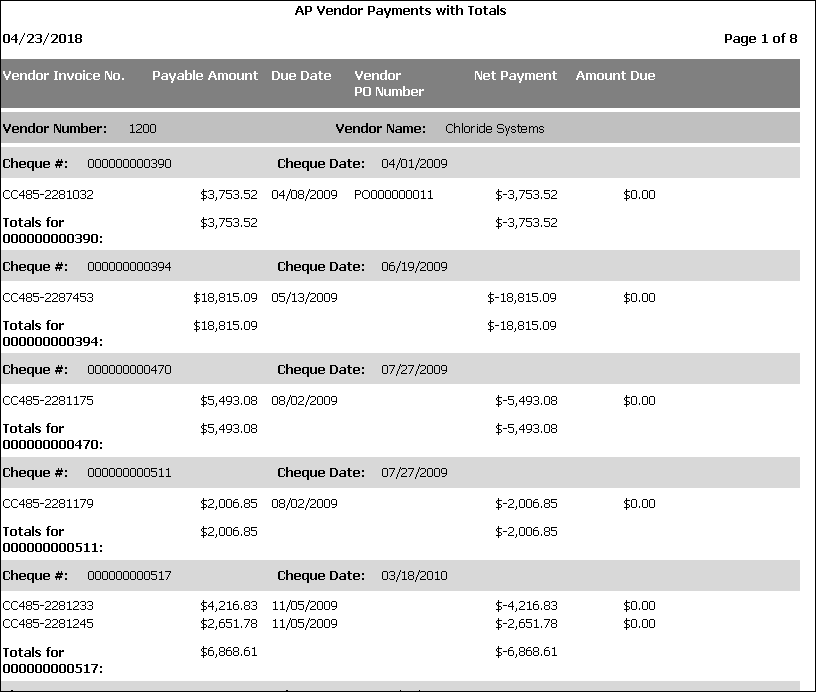
AP Vendor Payments with Totals.sfx: this report shows AP invoices and payments, including totals by check and vendor
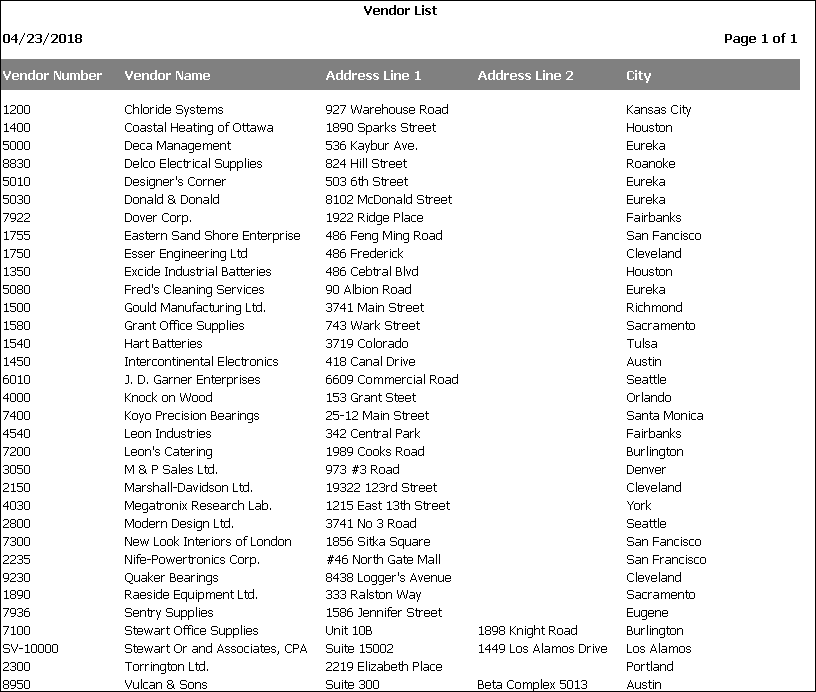
Vendor List.sfx: a nice short vendor list.
Vendors On Hold.sfx: vendors with a status of "on hold" (same layout as Vendor List).
AR Reports
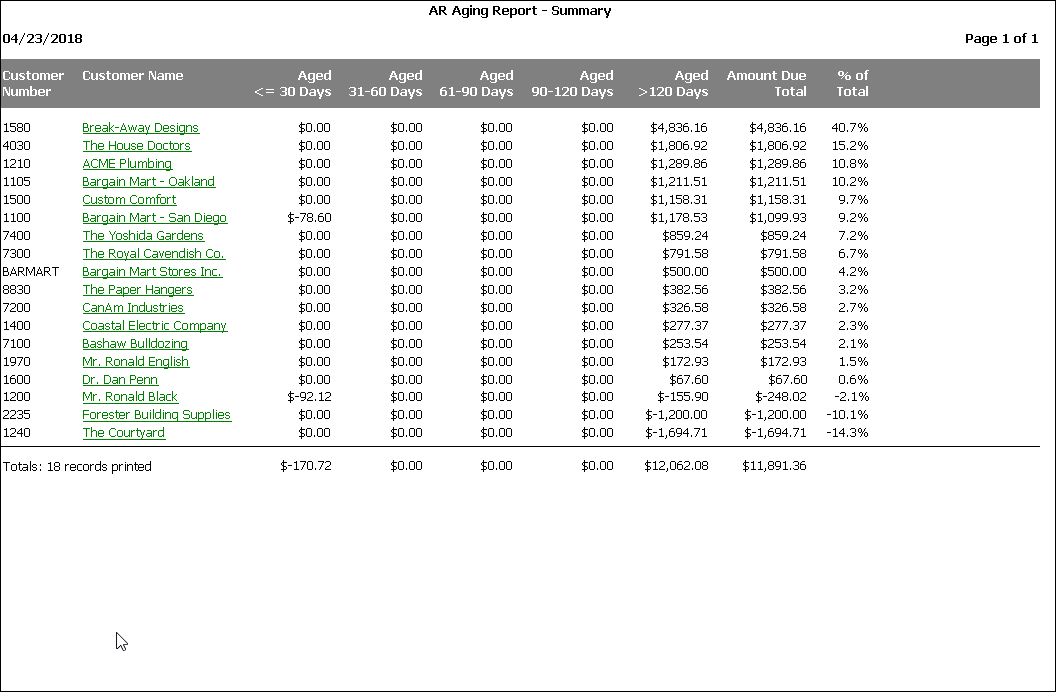
AR Aging Report - Summary.sfx: this shows a summarized AR aging report, with the largest amounts due at the top. Click the customer name to drill down to see the invoices.
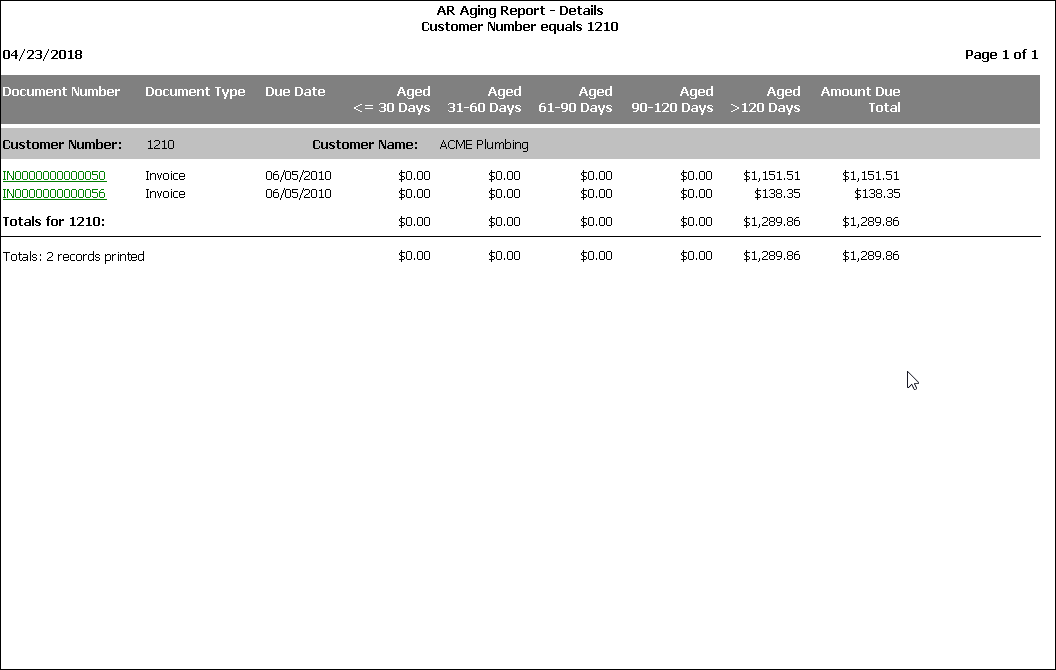
AR Aging Report - Details.sfx: this shows an AR aging report, displays invoices for a specific customer. Click the invoice number to drill down to see invoice details. It's the drill down report from AR Aging Report - Summary.
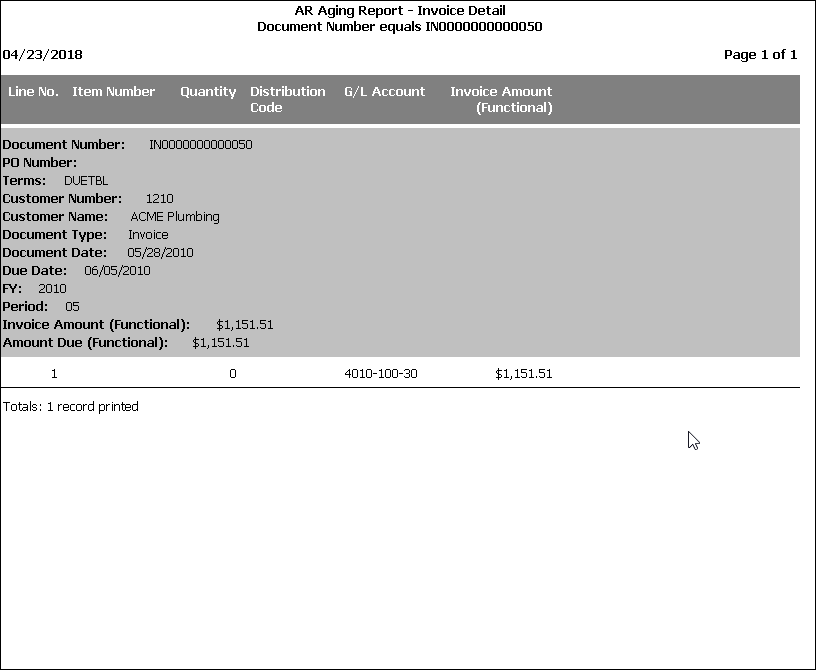
AR Aging Report - Invoice Detail.sfx: this report shows details for a specific invoice. It's used as the drill down from AR Aging Report - Invoice Detail.
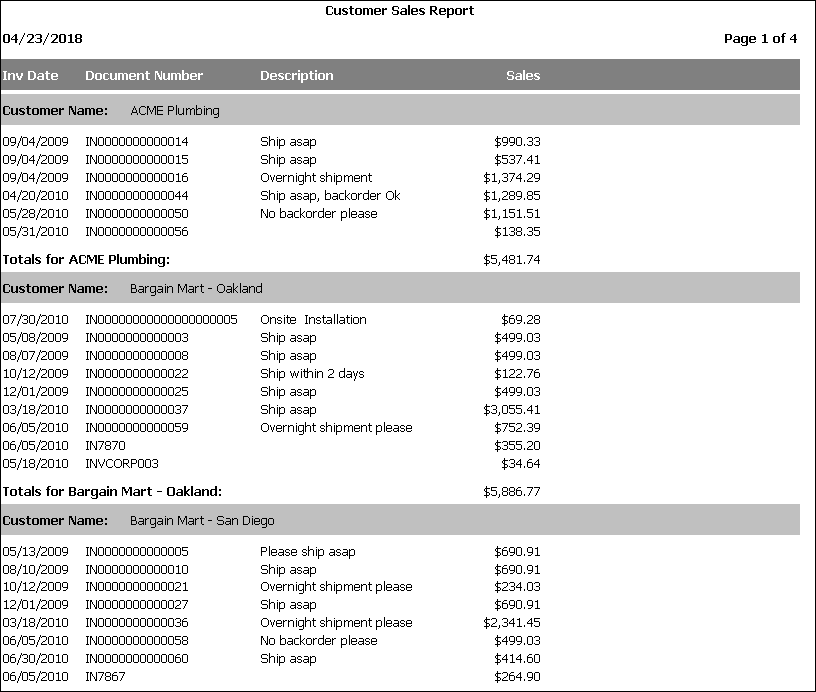
AR Sales by Customer.sfx: invoices by customer for a specified date range. If you print this with "Summary" checked, it shows total sales by customer for the date range (for example, YTD).
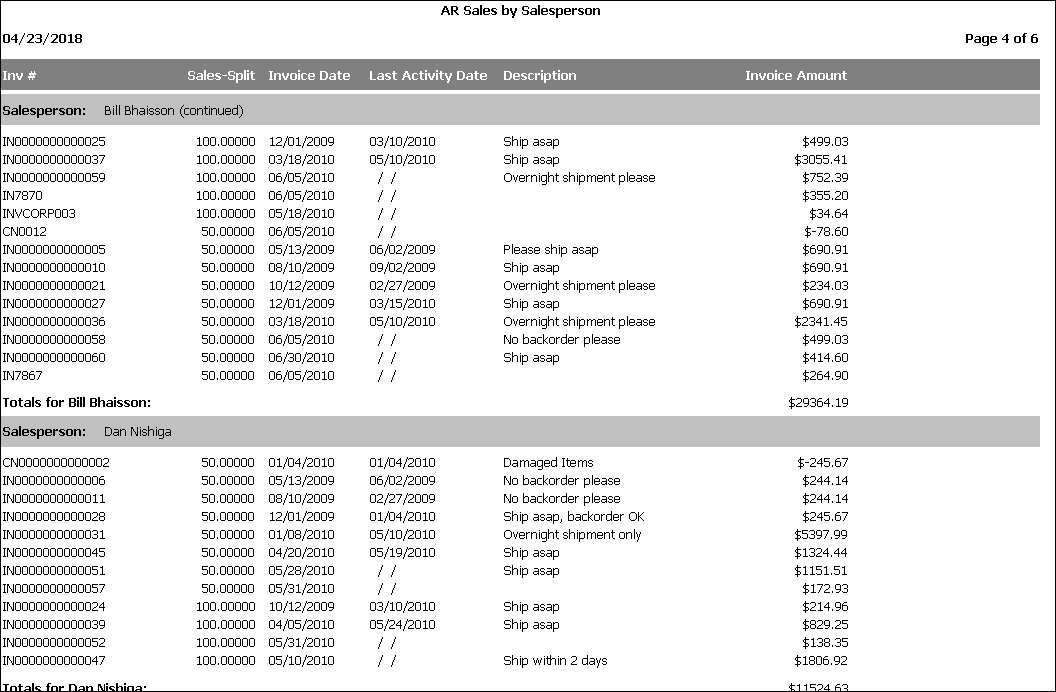
AR Sales by Salesperson #1.sfx: lists AR invoices for a specified invoice date range, grouped by Salesperson #1.
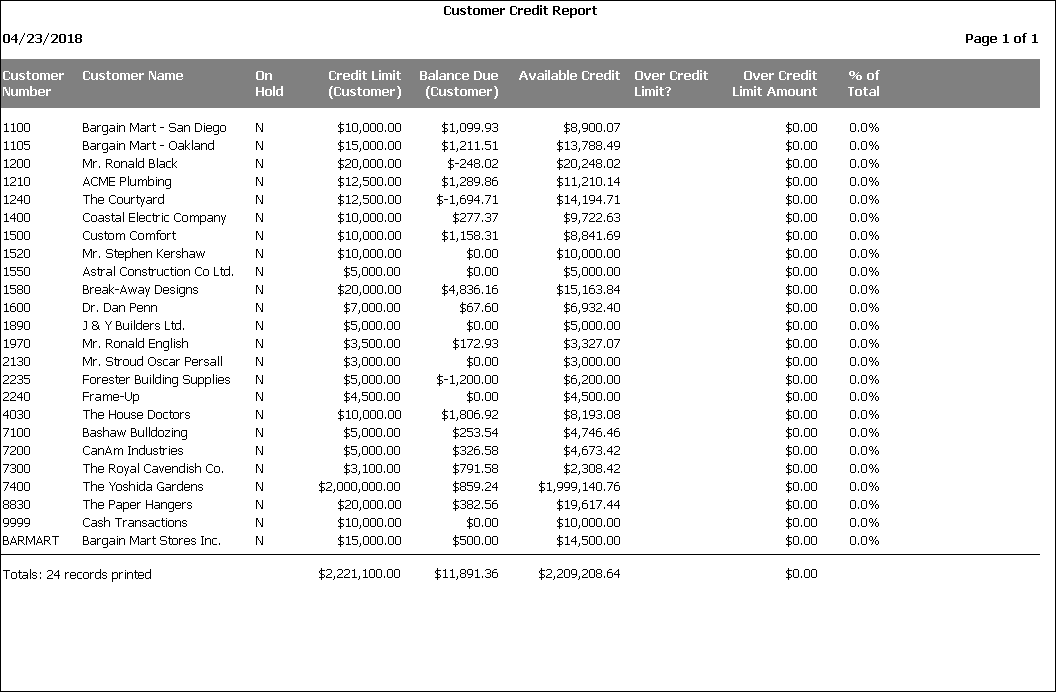
Customer Credit Report.sfx: this report shows credit information for customers.
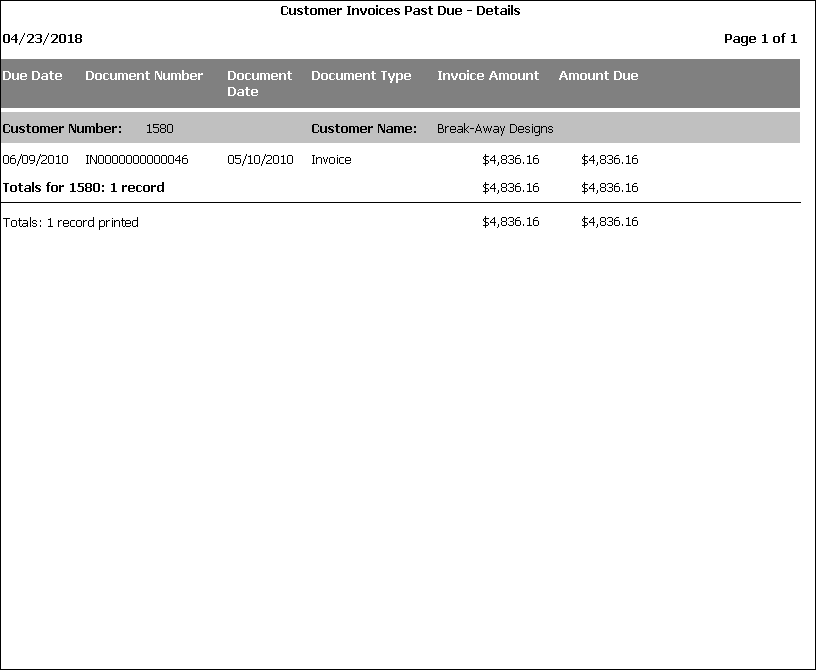
Customer Invoices Past Due - Details.sfx: this report is used as a drill down report, from Customer Invoices Past Due - Details on company name, to show the documents that make up the total on the summary report. The documents included as the ones that are past due (from today's date) with a balance outstanding.
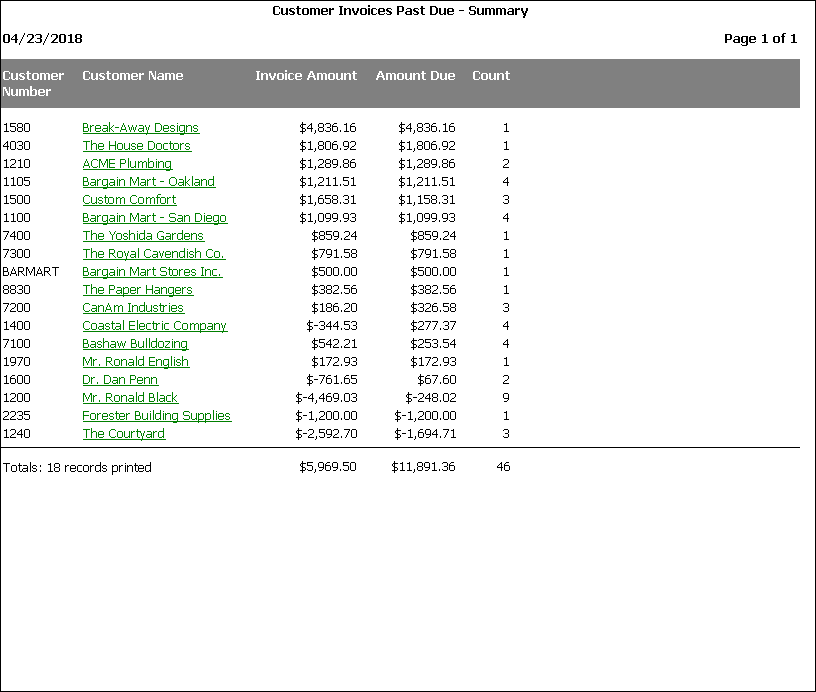
Customer Invoices Past Due - Summary.sfx: this report is a summary of all AR documents that have an outstanding balance. It includes a drill down, on the company name, to a detail report that show the documents that make up the total on this summary report. The documents included as the ones that are past due (from today's date) with a balance outstanding.
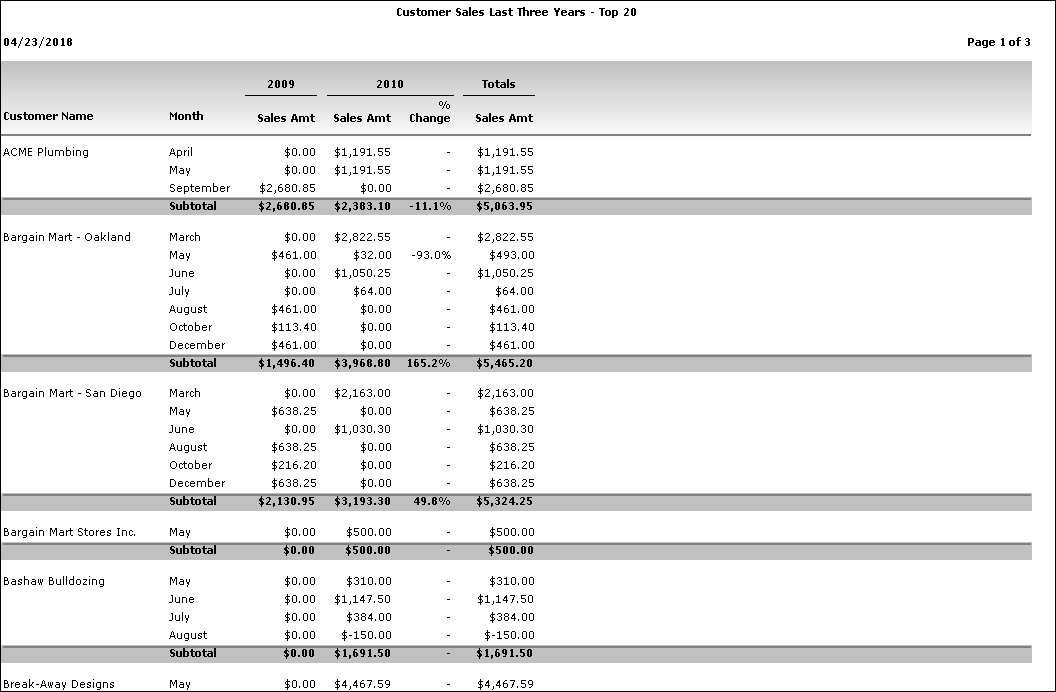
Customer Sales Last Three Years - Top 20.sfx: this report shows a comparison of sales for the last three years for the top 20 customers over those years.
Customers On Hold.sfx: lists customers with a status of "on hold". This has the same layout as Customers with Formatted Phone.
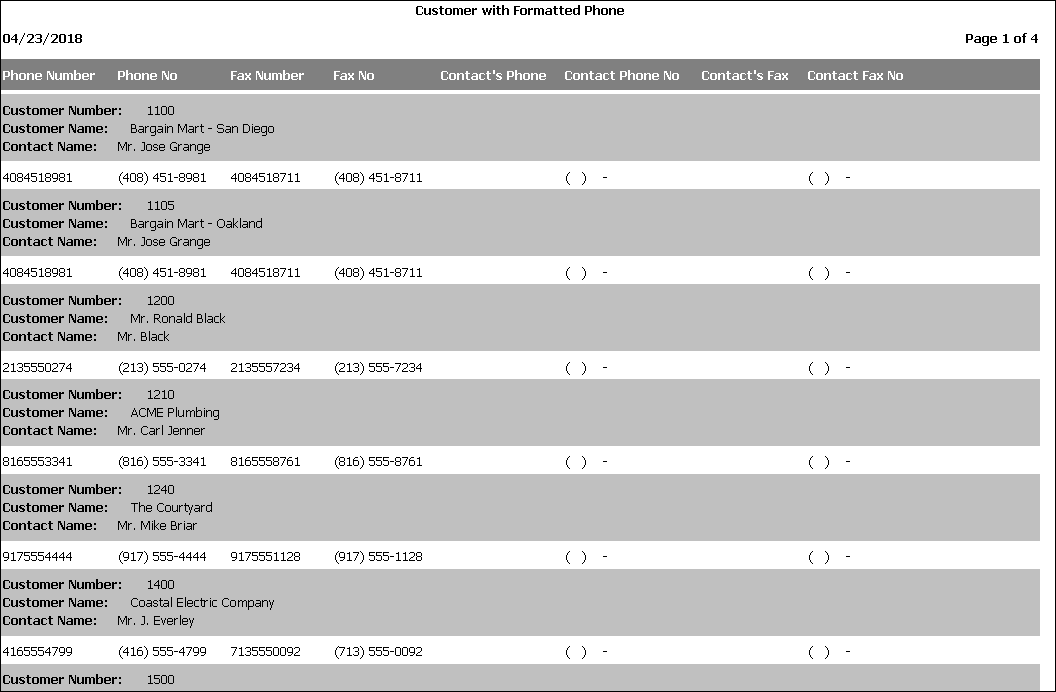
Customers with Formatted Phone.sfx: this report uses a formula to format phone and fax numbers nicely.
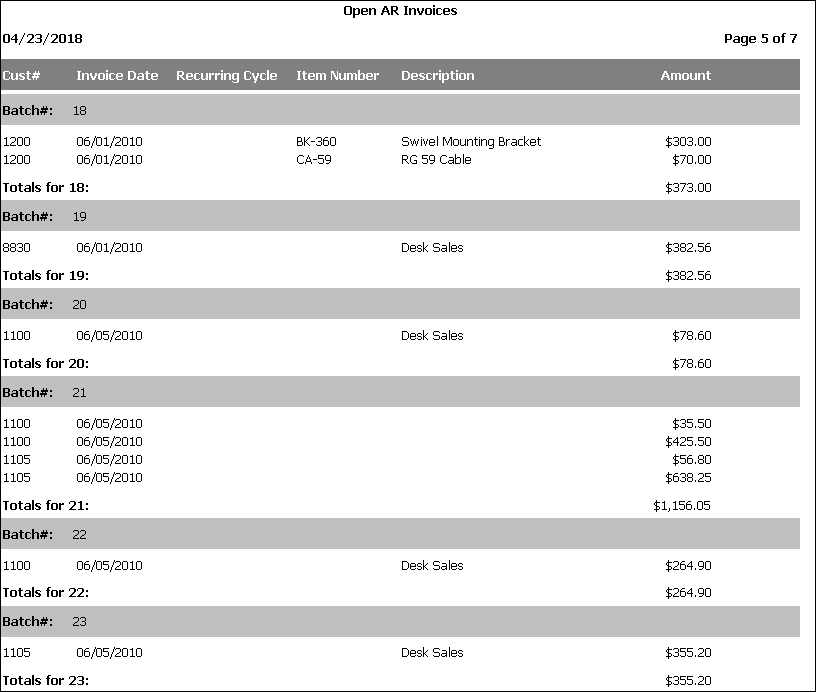
Open AR Invoices.sfx: prints a summary of the open invoice batches with the "Recurring Charge" and "AR Item" codes (if used).
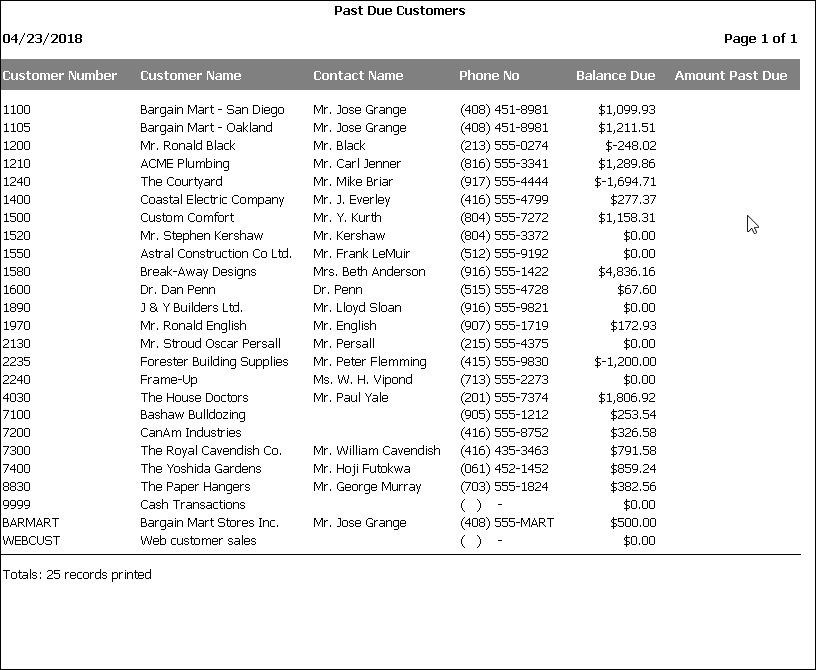
Past Due Customers.sfx: prints customers with an amount past due.
IC Reports
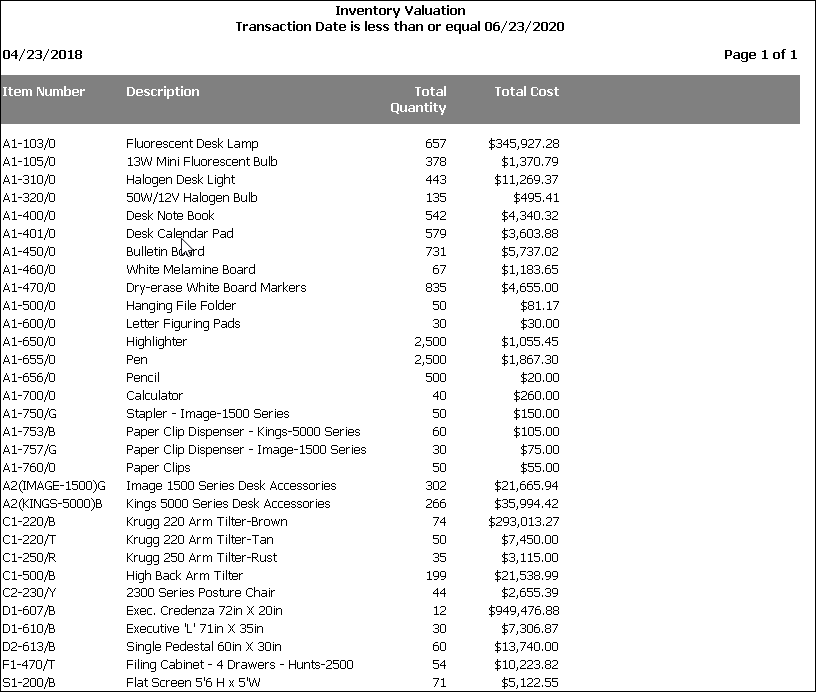
Inventory Valuation.sfx: this report shows the inventory valuation by item as of a specific date without regard to location.
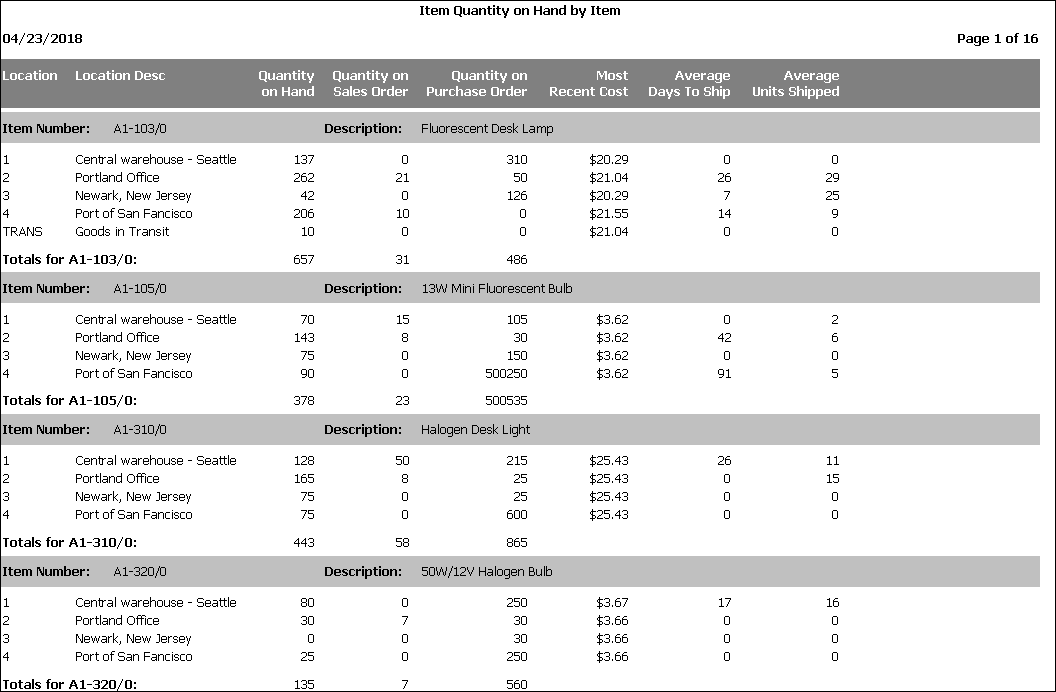
Item Quantity on Hand by Item.sfx: this report shows the current quantity on hand (before day-end) for inventory items by item number.
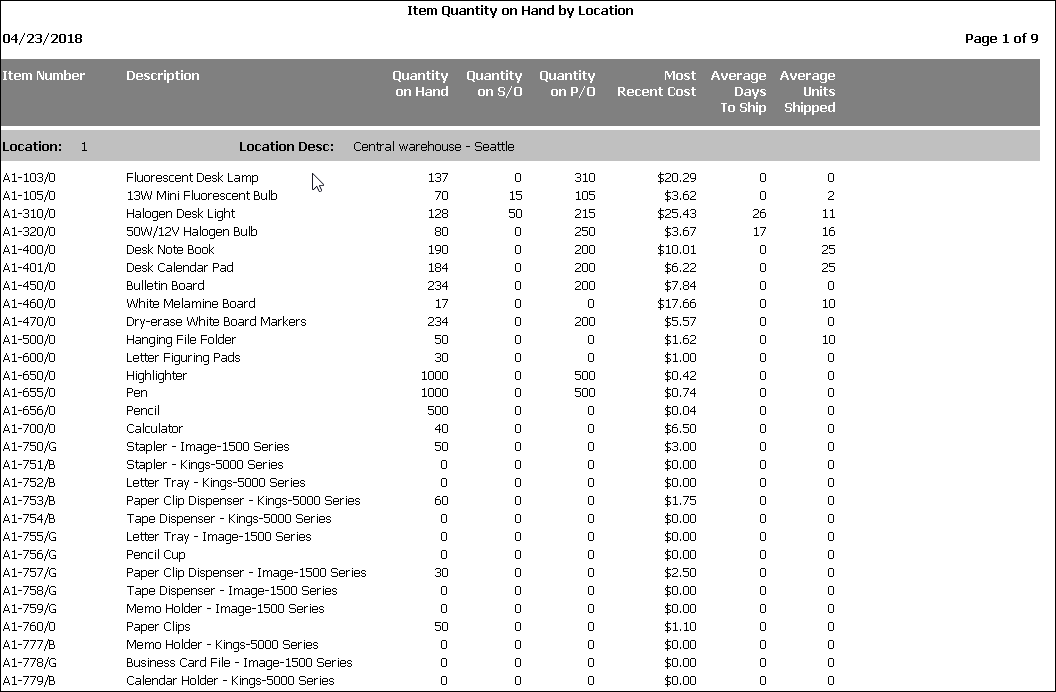
Item Quantity on Hand by Location.sfx: this report shows the current quantity on hand (before day-end) for inventory items by location.
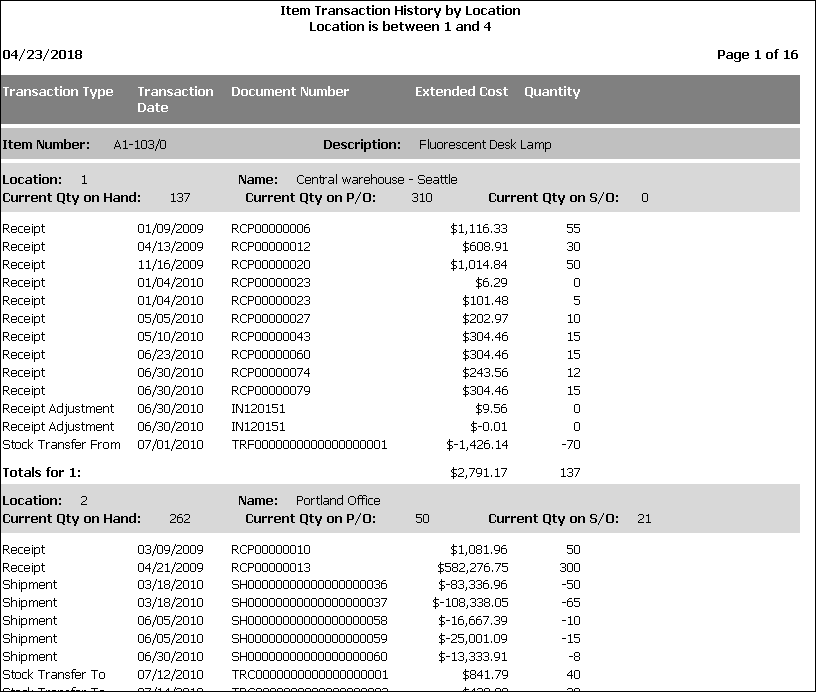
Item Transaction History by Location: this report shows item transaction history by item and location
Most Recent Shipments: this report shows the most recent shipments by item.
Canadian Payroll Reports
Cheque Advice.sfx: this report makes it easy to email payroll advices for a specific pay period to employees.
Cheque Advice Summary.sfx: like Cheque Advice.sfx but summarizes earnings if there's more than one entry for the same earnings code.
Cdn Payroll Check Run Report by Department.sfx: this report summarizes payroll by department (Segment Code 1) and earnings/deduction type.
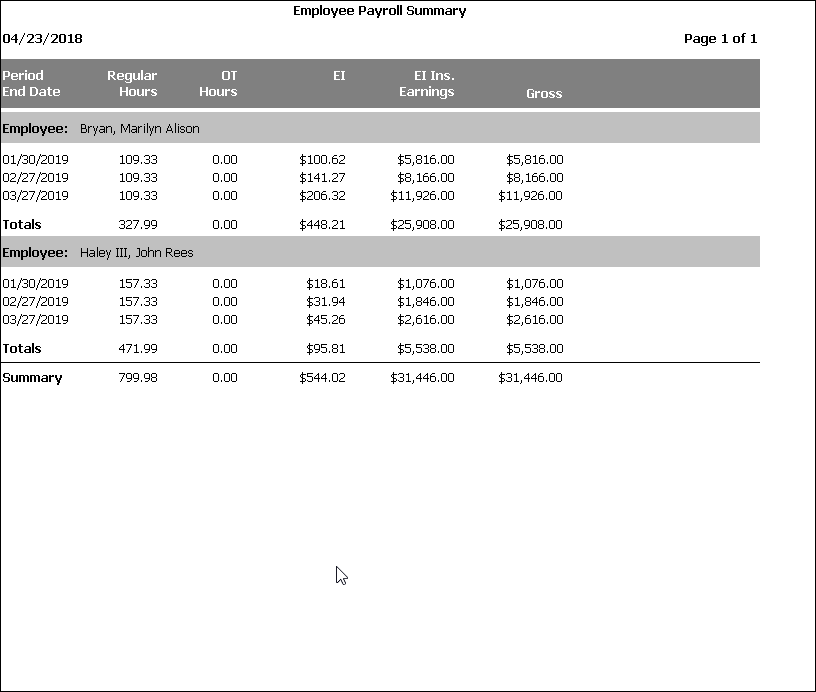
Employee Payroll Summary.sfx: this report summarized regular hours, OT hours, EI ins. earnings, EI paid, and gross salary by employee by pay period.
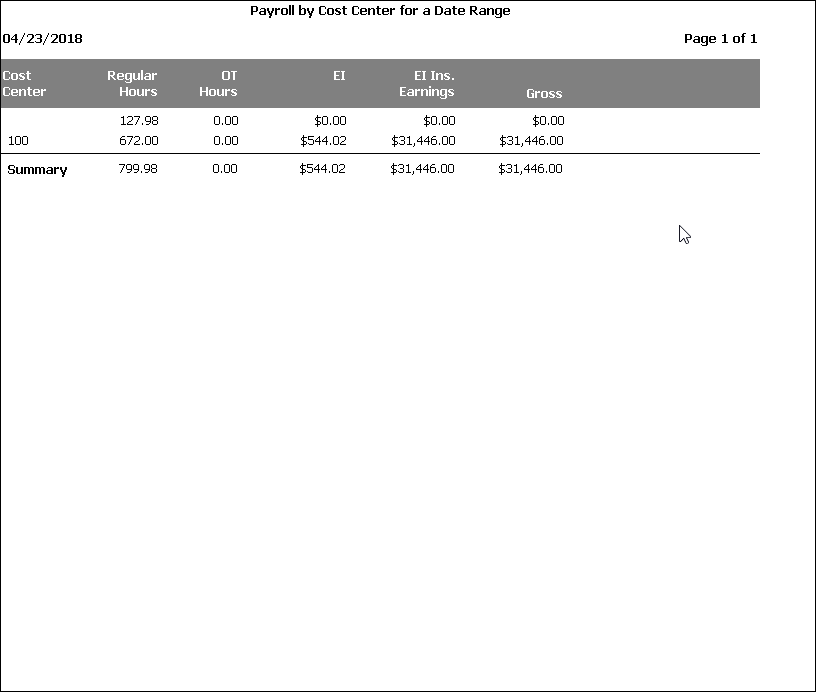
Payroll by Cost Center for a Date Range.sfx: this report summarized regular hours, OT hours, EI ins. earnings, EI paid, and gross salary by employee by pay period.
US Payroll Reports
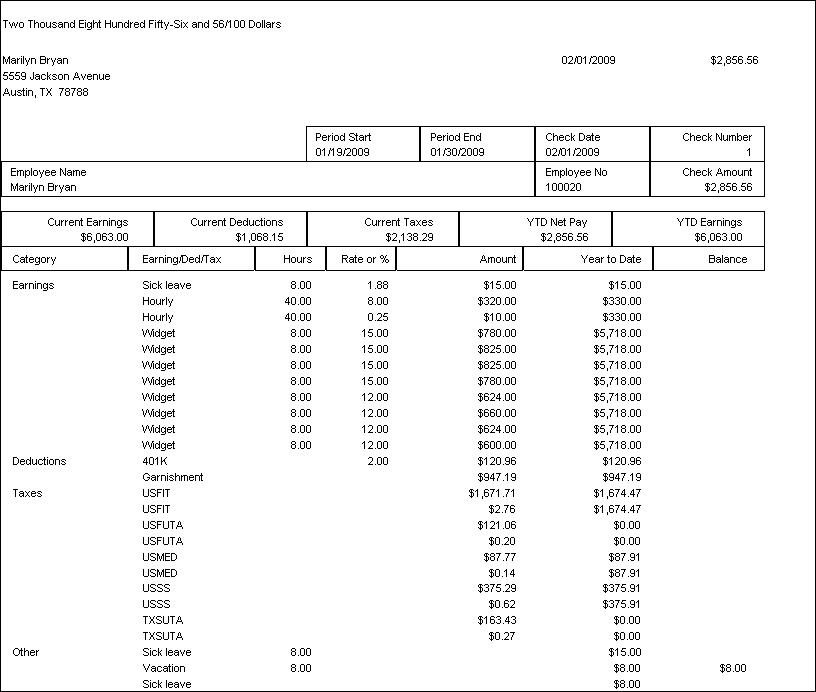
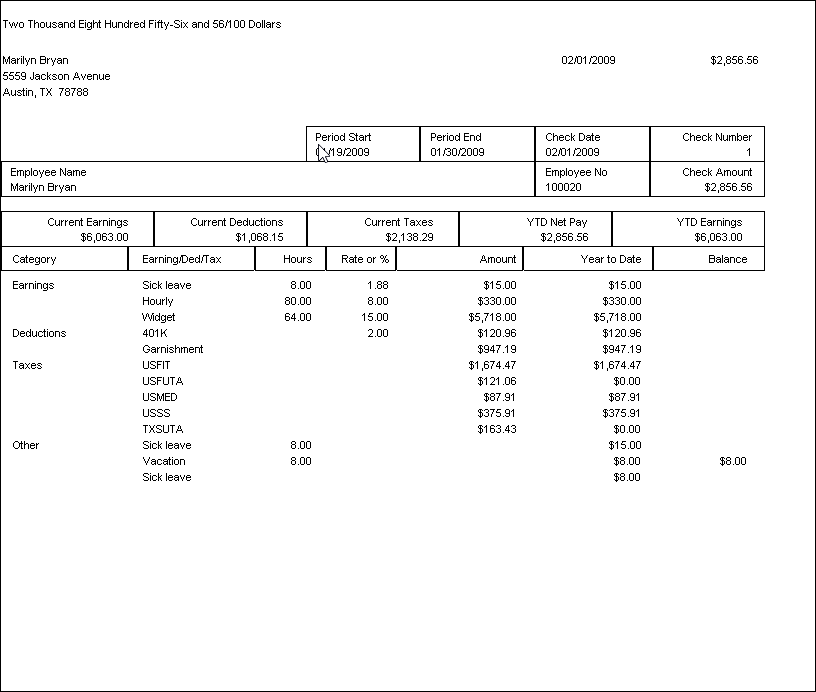
Check Advice.sfx: this report makes it easy to email payroll advices for a specific pay period to employees.
Check Advice Summary.sfx: like Check Advice.sfx but summarizes earnings if there's more than one entry for the same earnings code.
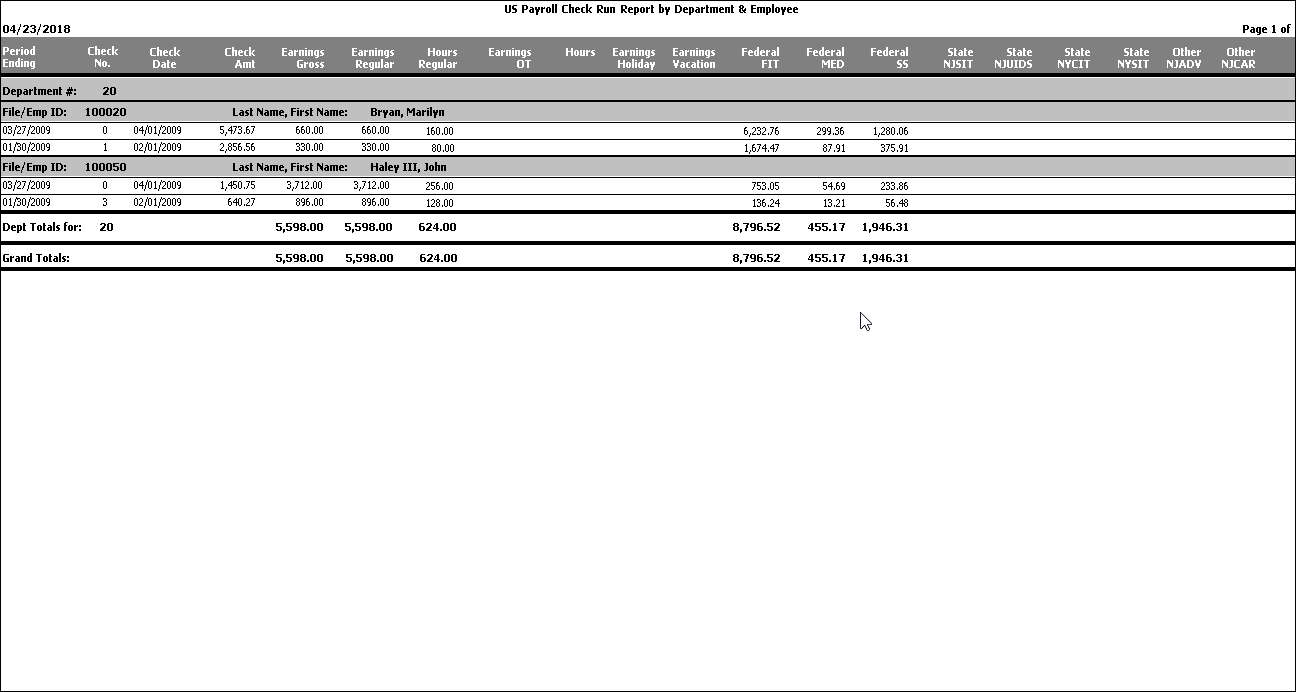
US Payroll Check Run Report by Department & Employee.sfx: this report breaks down payroll check runs by department, employee, and deduction.
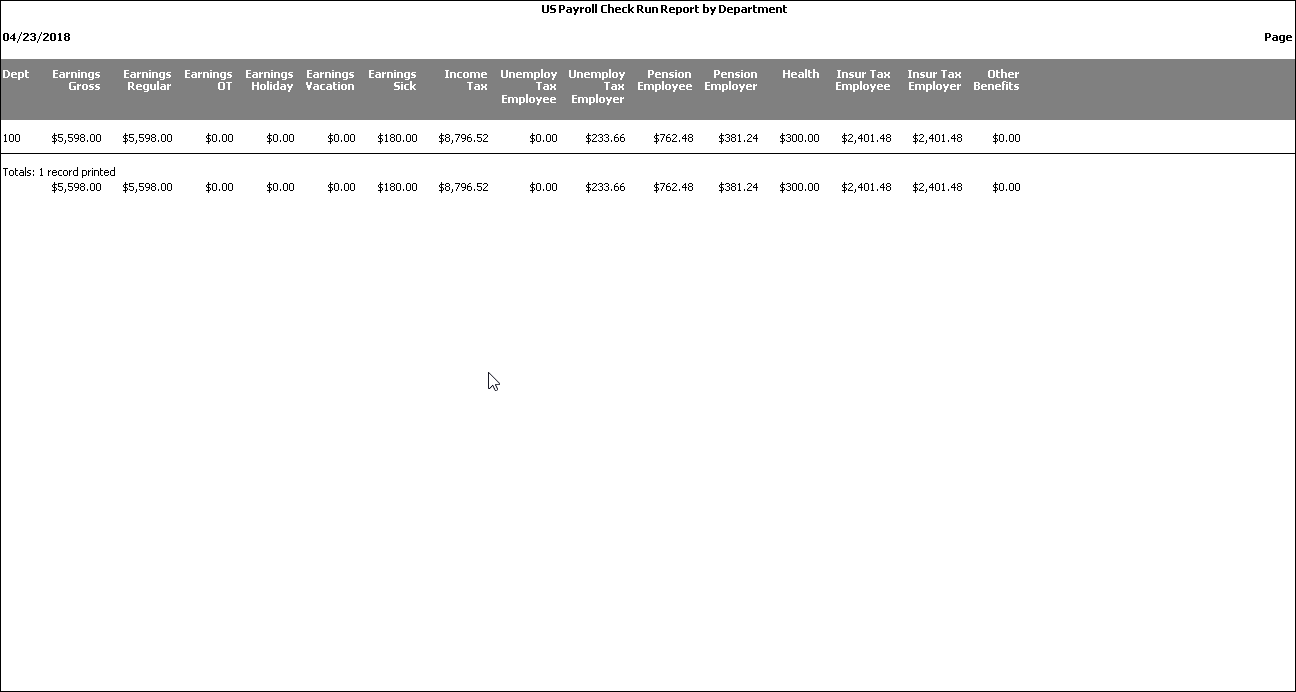
US Payroll Check Run Report by Department.sfx: this report summarizes payroll by department (Segment Code 1) and earnings/deduction type.
OE Reports
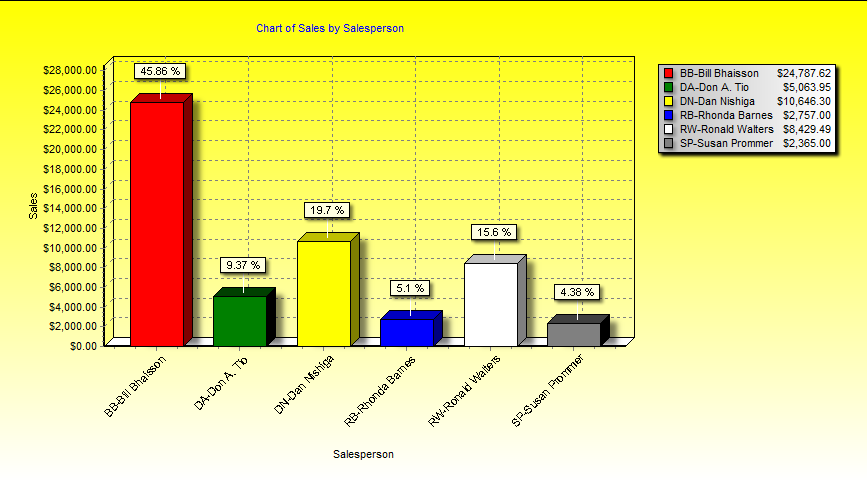
Chart of Sales by Salesperson.sfx: shows a chart of sales by salesperson.
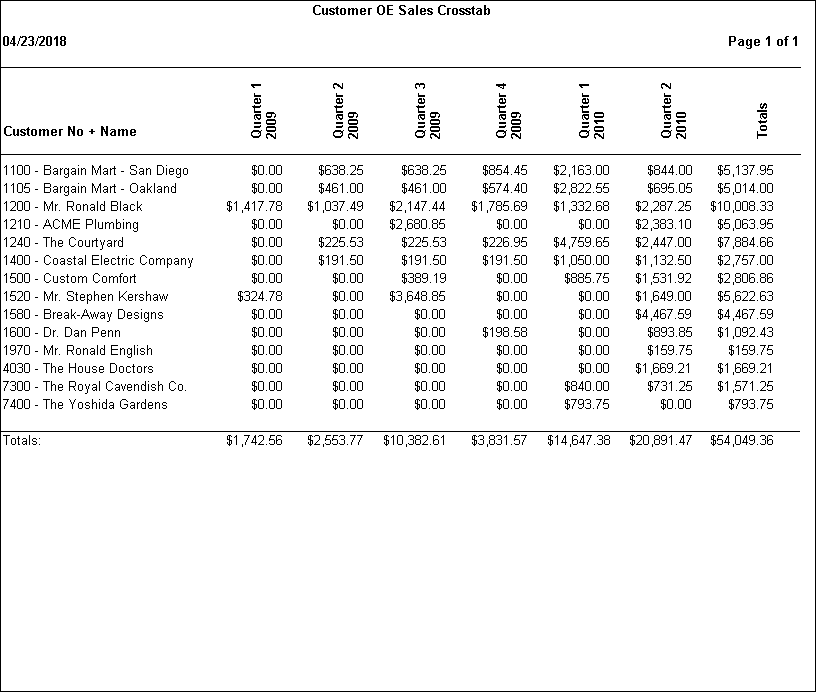
Customer OE Sales Crosstab.sfx: this is an example cross tab report based on the OE Sales History information. You can change the columns to weeks, months, quarters or years by selecting Properties of the Transaction Date field in step 3 of the wizard. How many columns that appear will depend on the date filter that you apply when runnnig the report.
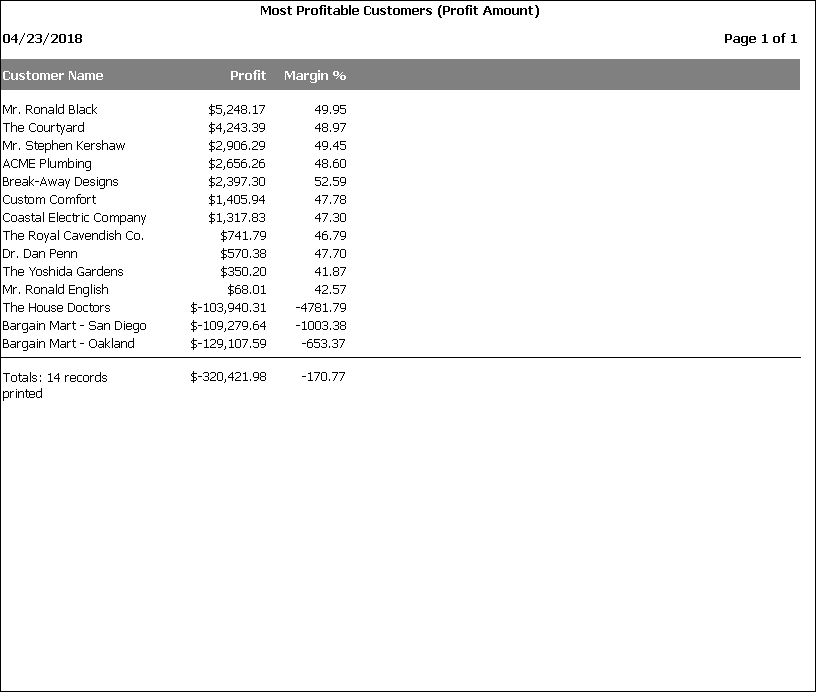
Most Profitable Customers (Profit Amount).sfx: most profitable customers based on profit amount.
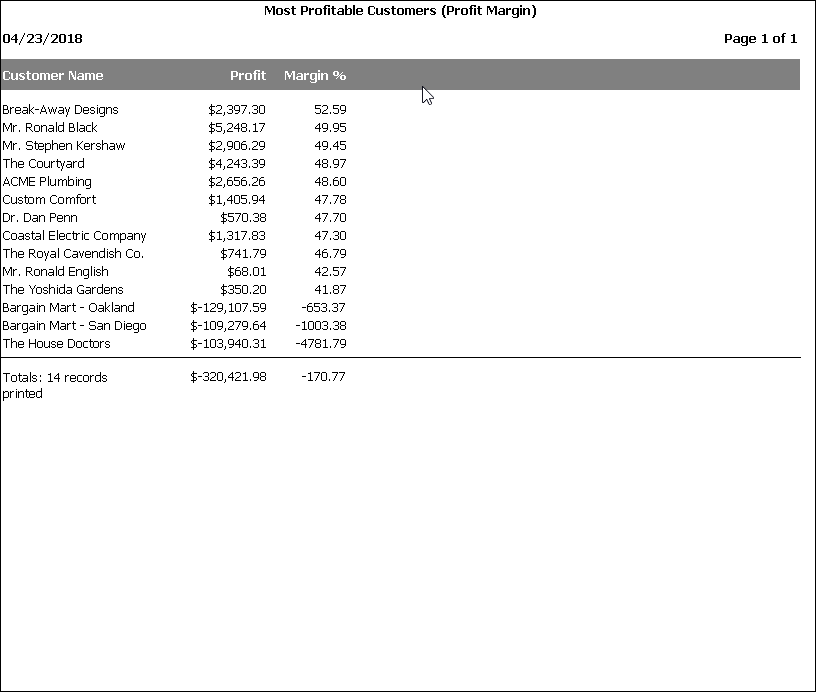
Most Profitable Customers (Profit Margin).sfx: most profitable customers based on profit margin.
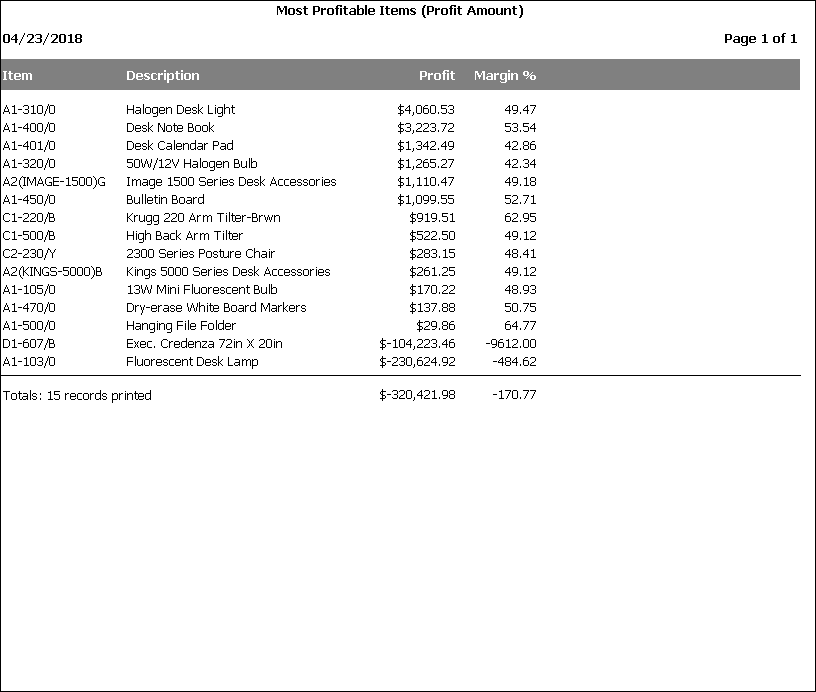
Most Profitable Items (Profit Amount).sfx: most profitable items based on profit amount.
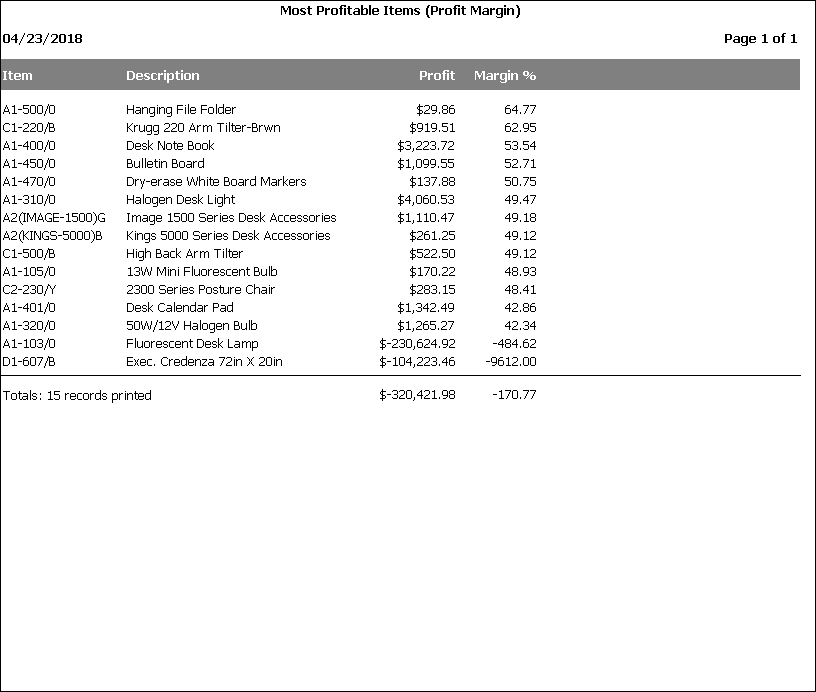
Most Profitable Items (Profit Margin).sfx: most profitable items based on profit margin.
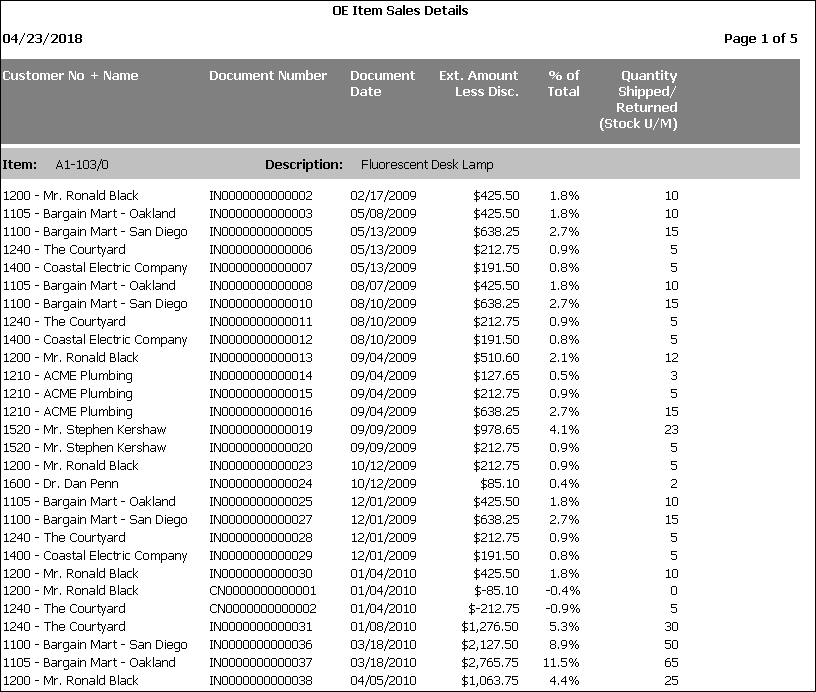
OE Item Sales Details.sfx: this report is an example of how you can report on the Combined Invoice/Credit Note tables (both header and details) to get both the invoice and credit note transactions into one report. If the document is a credit note then the amounts/qty is made negative. The qty is also converted into the stock unit of measure.
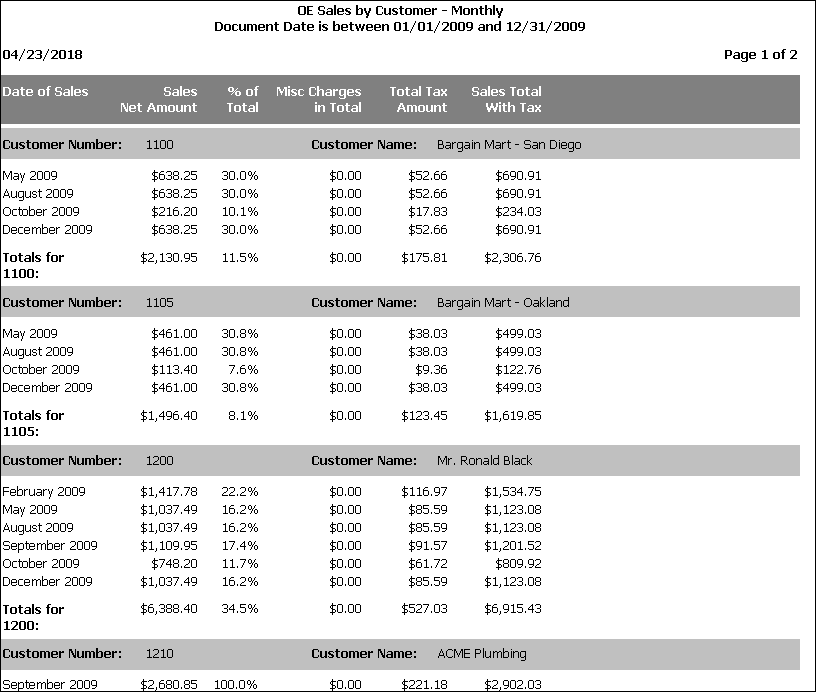
OE Sales by Customer - Monthly.sfx: this report is based on the combined invoices and credit note tables and shows how you can set the format of a date field to only show the month and year allowing you to group on it and make a summary report.
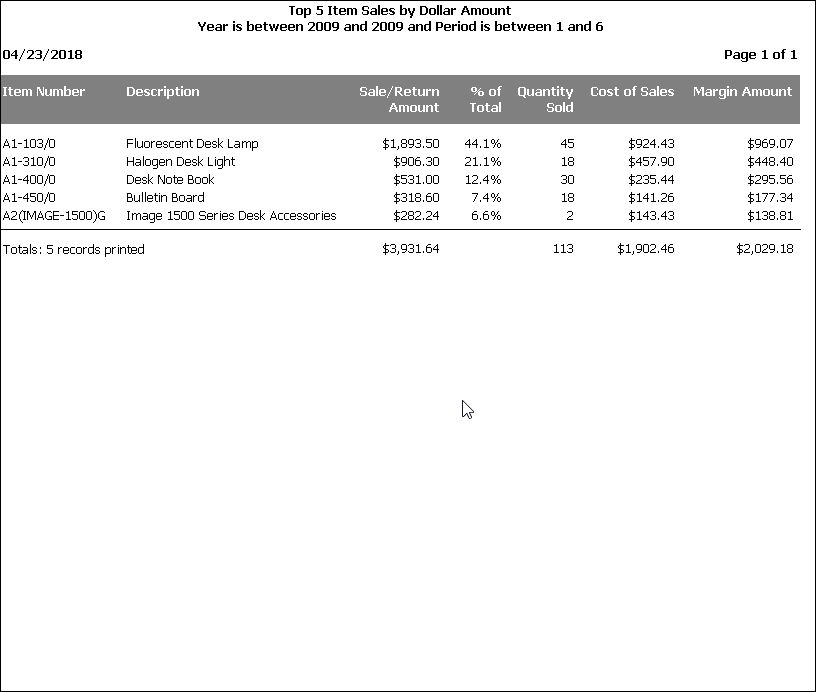
Top 5 Item Sales by Dollar Amount.sfx: this report shows the top 5 items based on sales dollar amount. You can increase the number of item shown on the rpeort by selecting the Advanced button in Step 2 of the Report Wizard and setting the number of items that you would like included in the report in the 'Select only top' records field.
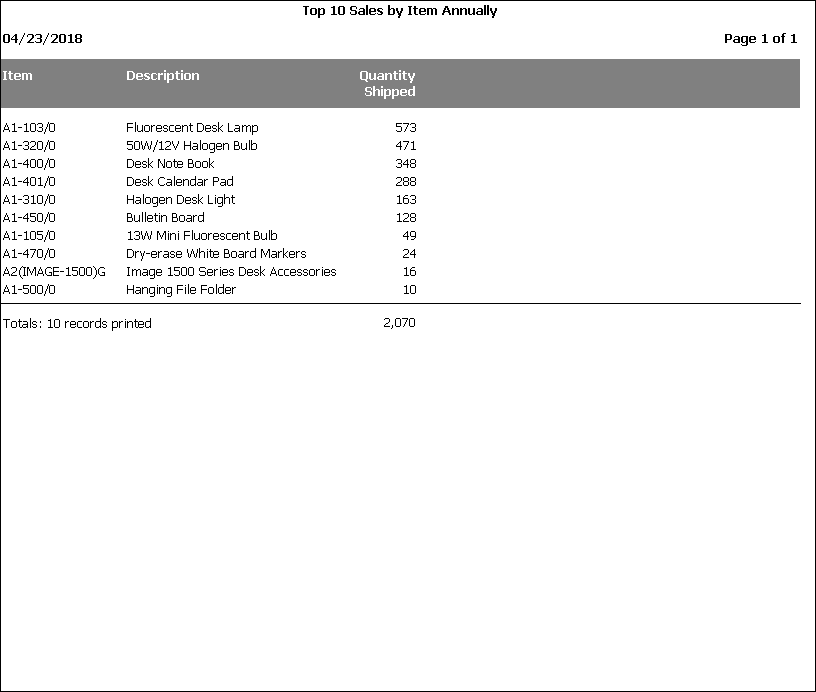
Top 10 Sales by Item Annually.sfx: top 10 sales by item based on order quantity.
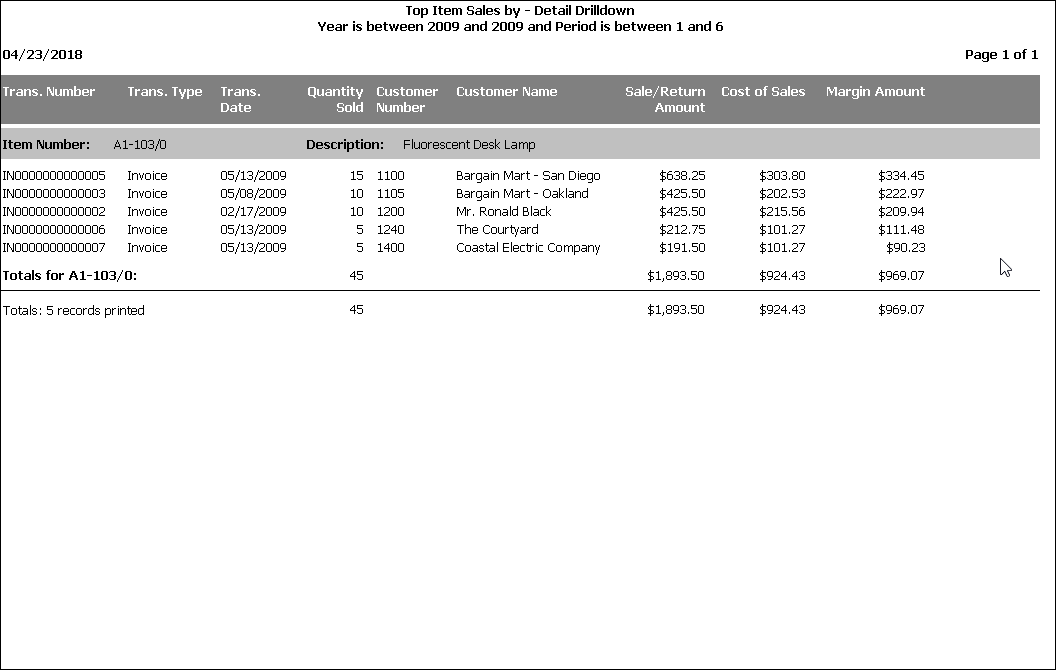
Top Item Sales by - Detail Drilldown.sfx: this report is used as the drill down report by the following reports: Top Item Sales by Dollar Amount, Top Item Sales by Margin, and Top Item Sales by Quantity.
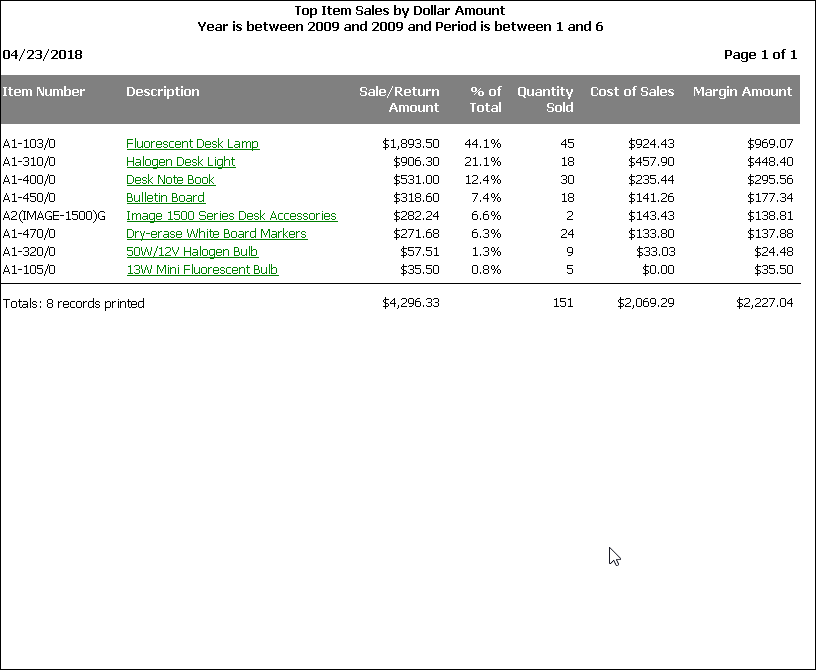
Top Item Sales by Dollar Amount.sfx: this report shows the item sales amounts as a summary report in descending order. You can drill down to see the details that make up the totals (report it drills down to is Top Item Sales by - Detail Drilldown).
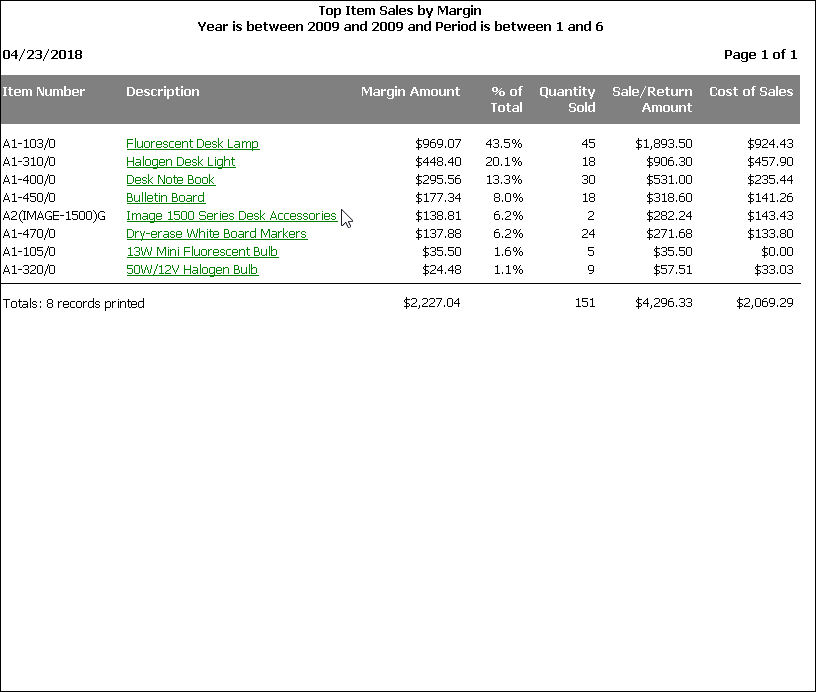
Top Item Sales by Margin.sfx: this report shows the item margin amounts as a summary report in descending order. You can drill down to see the details that make up the totals (report it drills down to is Top Item Sales by - Detail Drilldown).
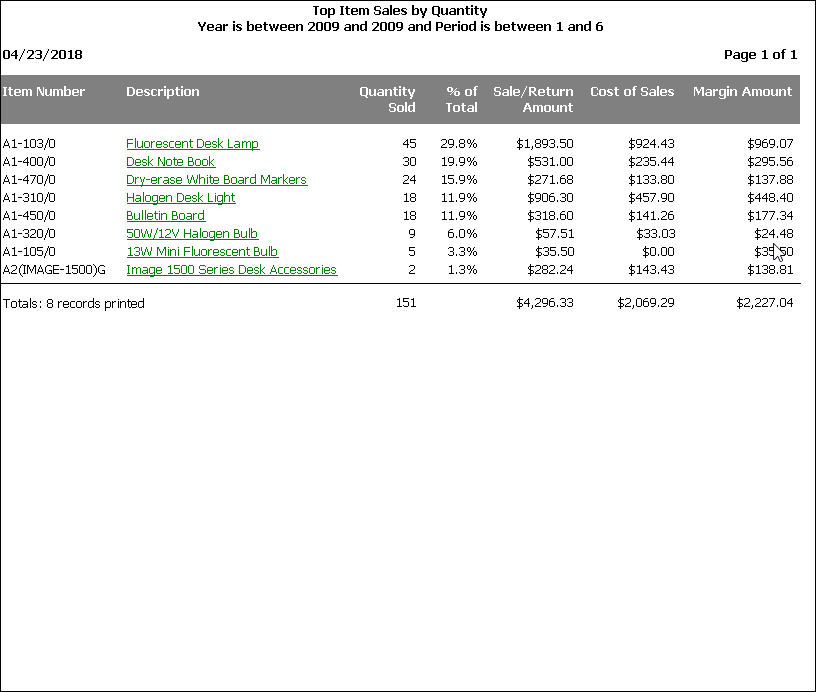
Top Item Sales by Quantity.sfx: this report shows the item quantity as a summary report in descending order. You can drill down to see the details that make up the totals (report it drills down to is Top Item Sales by - Detail Drilldown).
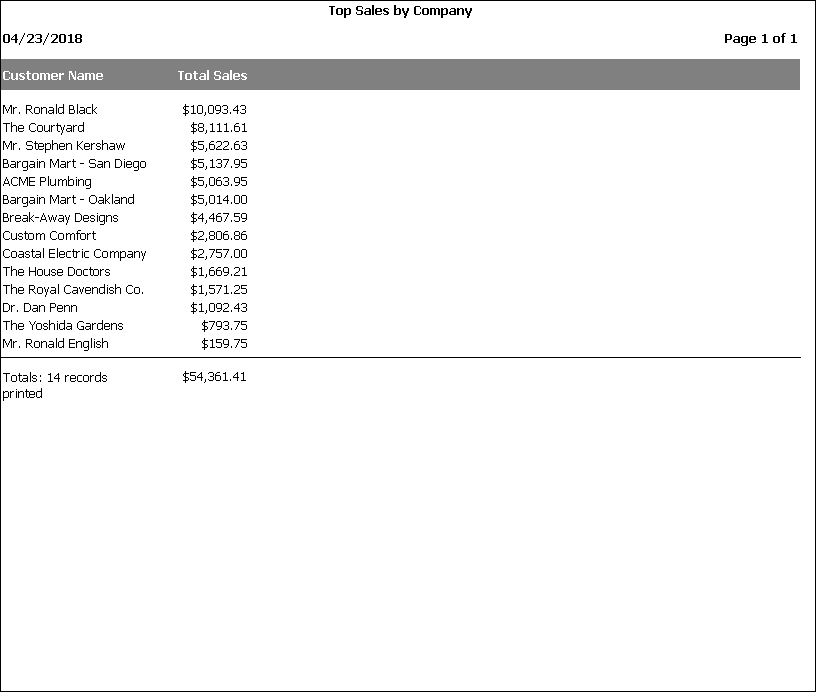
Top Sales by Company.sfx: top sales by customer for a specified time period.
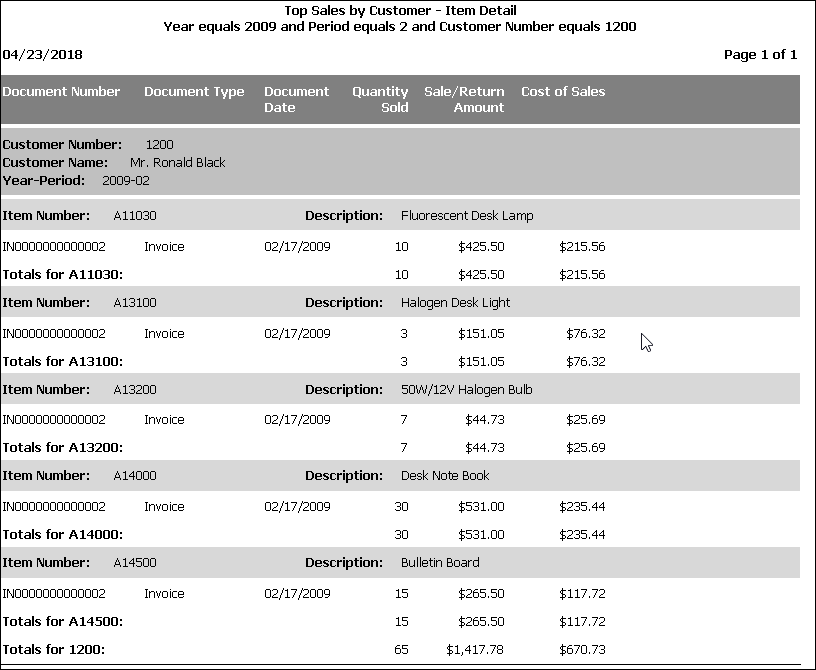
Top Sales by Customer - Item Detail.sfx: this report is used as a drill down report by Top Sales by Customer - Year-Period Detail.
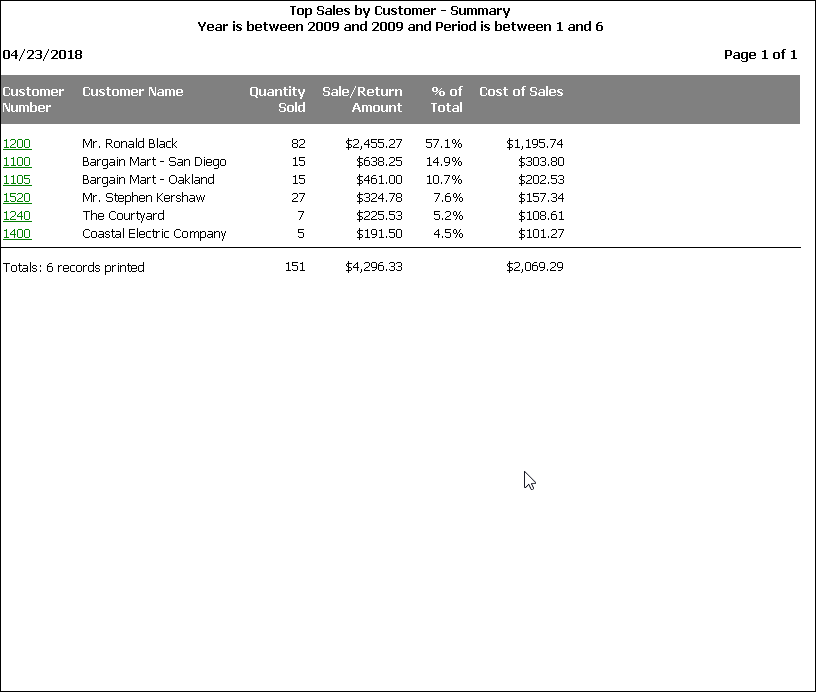
Top Sales by Customer - Summary.sfx: this report is a summary of customer sales for the specified period selected. You can drill down to find out the amounts per period.
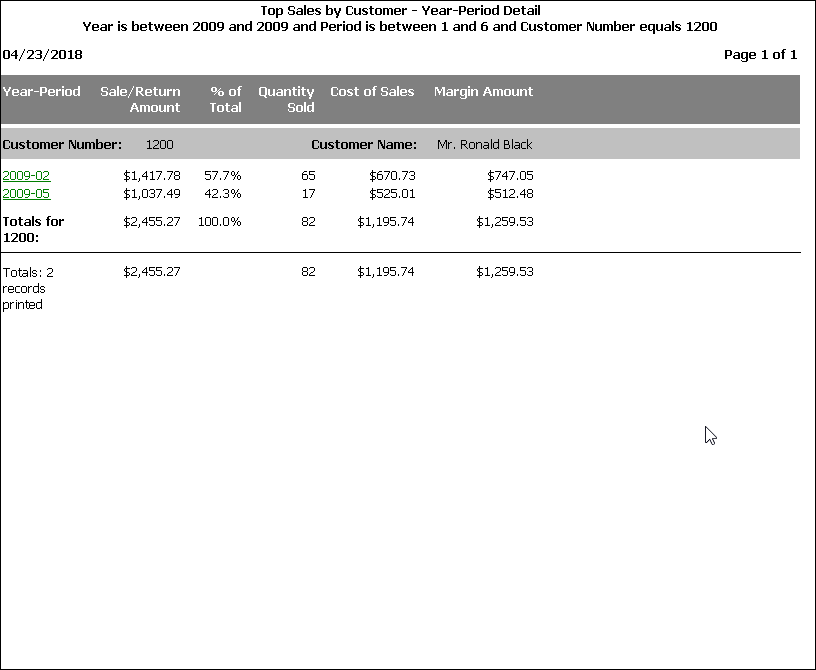
Top Sales by Customer - Year-Period Detail.sfx: this report is used as a drill down report by Top Sales by Customer - Summary.
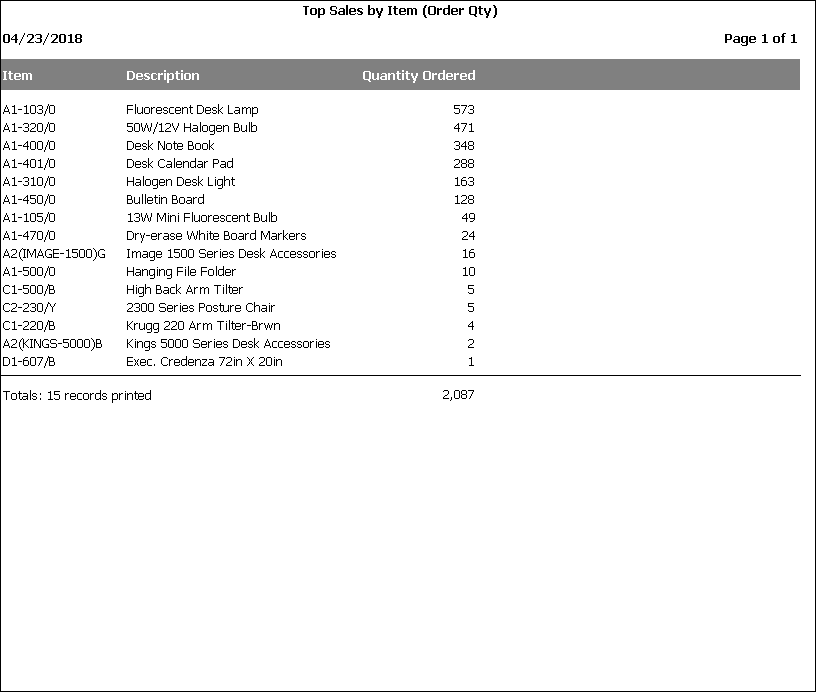
Top Sales by Item (Order Qty).sfx: this report shows the items by order quantity in descending order.
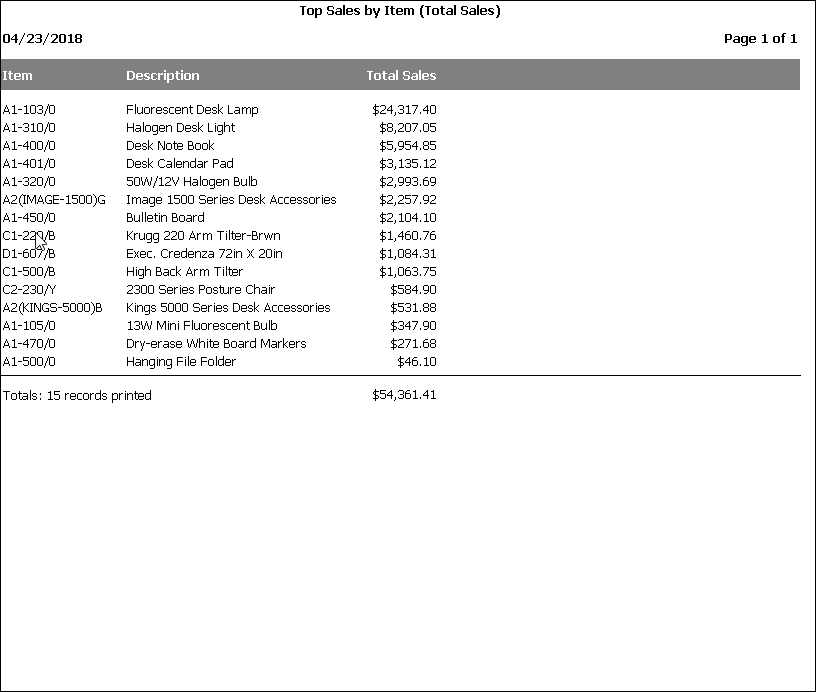
Top Sales by Item (Total Sales).sfx: top sales by item based on total sales.
New in 4.1
These reports demonstrate new features added in Stonefield Query version 4.1.
My Dashboard.sfx: this shows an example of a dashboard combining two charts.
Sales by Month and Year.sfx: this report shows several new features: change between columns, dates formatted as month, and no row totals.
Sales by Product.sfx: this chart shows a summary of sales by product and drills down to the Product Details report.
Product Details.sfx: this report is drilled down to from the Sales by Product chart.
New in Version 5.2
These reports demonstrate new features added in Stonefield Query version 5.2.
Margin Calculation.sfx: this report shows how a formula can be re-calculated at the group level. Margin, which is (Price - Cost)/Price as a percentage, can be calculated for each item but it's complicated calculating the margin for an invoice; you can't sum or average the margin for each item but instead have to calculate it at the invoice level. The new Calculate Value at Group Level setting for formulas makes this easy.
Most Recent Invoice by Customer.sfx: this report shows how the new Number of Records per Group setting allows you to retrieve just the most recent invoice for each customer.
Products Customers Purchased.sfx: this report shows the new Combine function of grouping formulas to show which customers purchased which products.
Sales by Year.sfx: This report shows how the new grouping formula feature can calculate the sales for each customer for a certain year.
New in Version 7.0
These reports demonstrate new features added in Stonefield Query version 7.0.
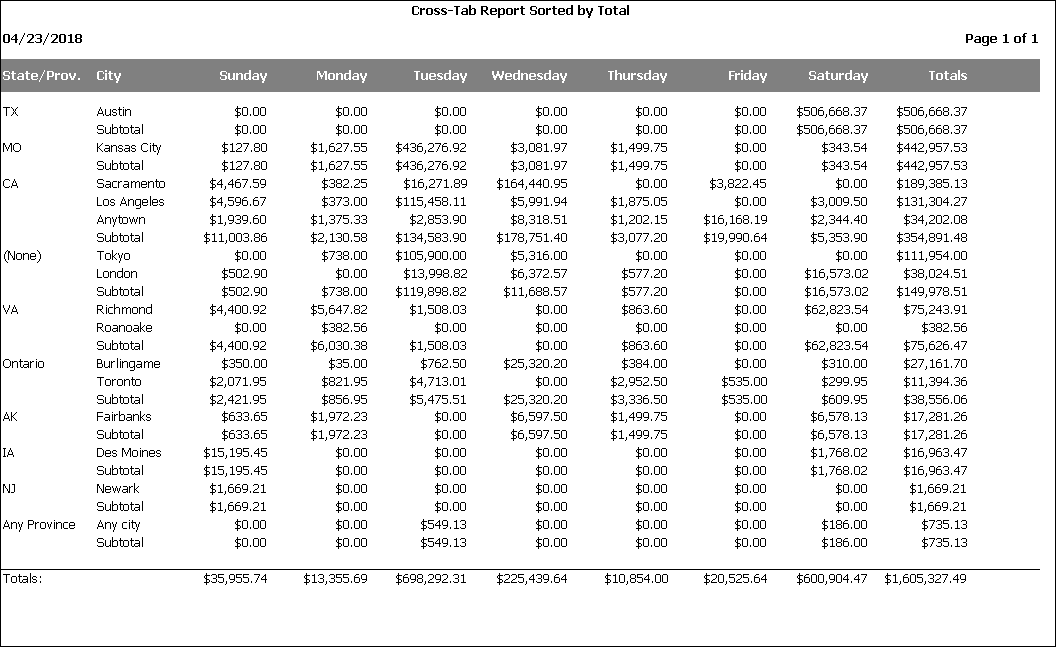
Cross-Tab Report Sorted by Total.sfx: Cross-tab reports can now be sorted on the total of the data field. This report also shows the new Day display type for date fields.
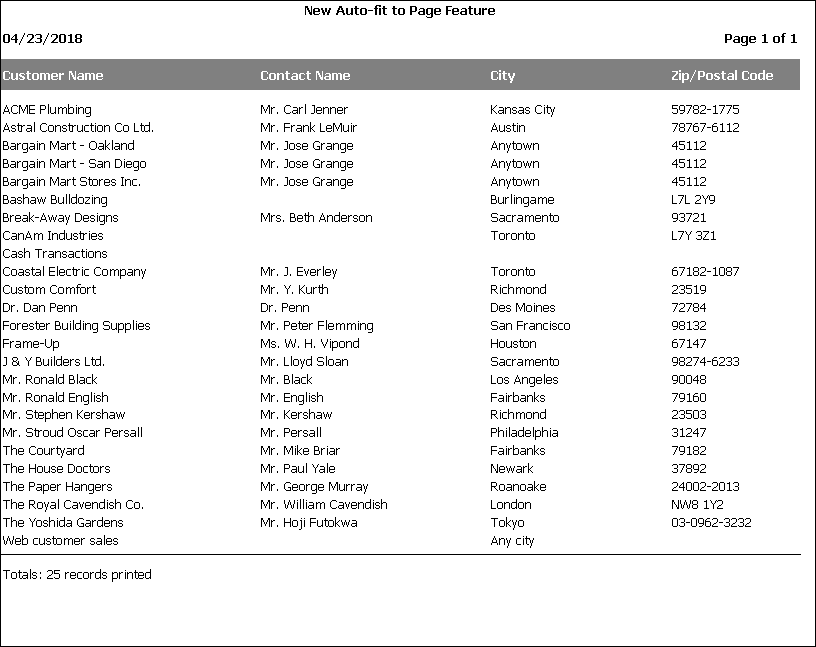
New Auto-fit to Page Feature.sfx: Auto-fit to page now spreads fields evenly across the page by adding additional space between columns.
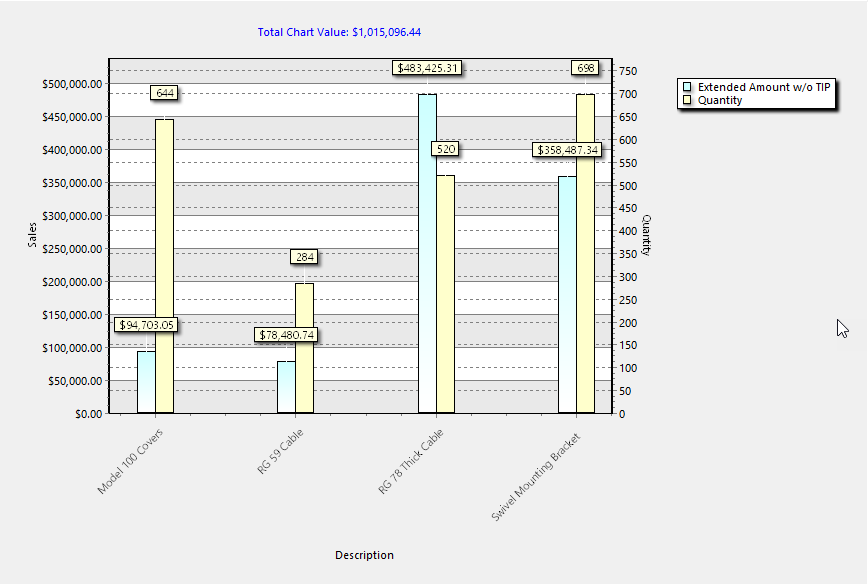
Right-Axis Title.sfx: This report shows how you can set the right-axis title for a chart and have the legend display the titles rather than field headings. It also shows how to display the total value for the chart in a title.
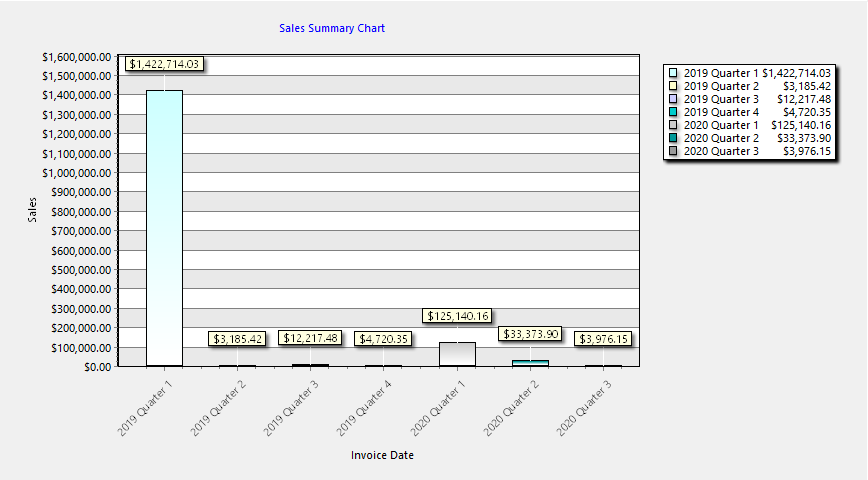
Sales Summary Chart.sfx: This chart drills down to the Detailed Sales Report report. It shows how you can drill down from an aggregate date, such as Quarter, to a date range.
New in Version 7.3
These reports demonstrate new features added in Stonefield Query version 7.3.
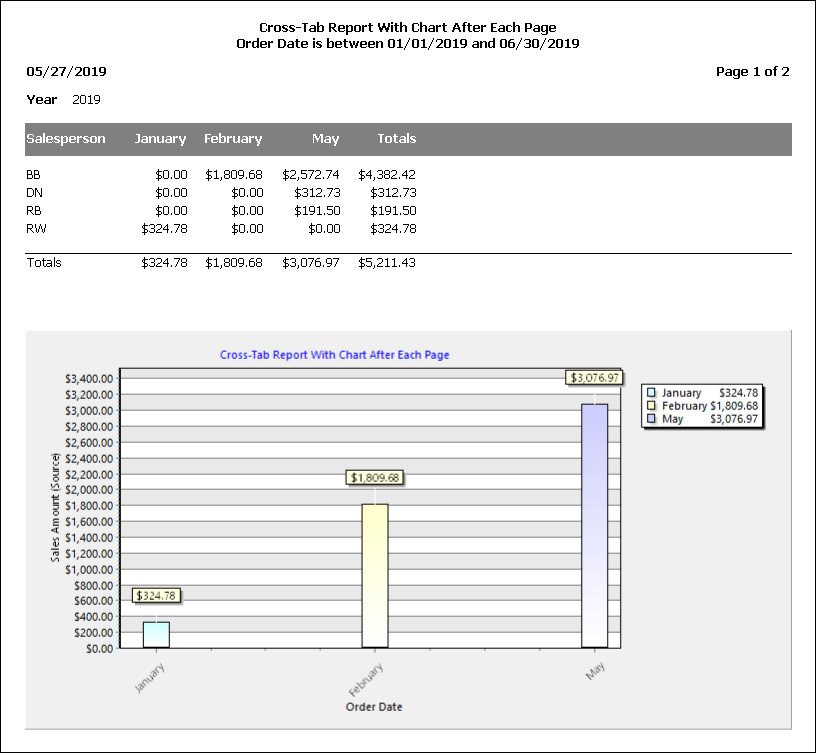
Cross-Tab Report With Chart After Each Page.sfx: This cross-tab report has a chart at the end of each page field rather than the end of the report.
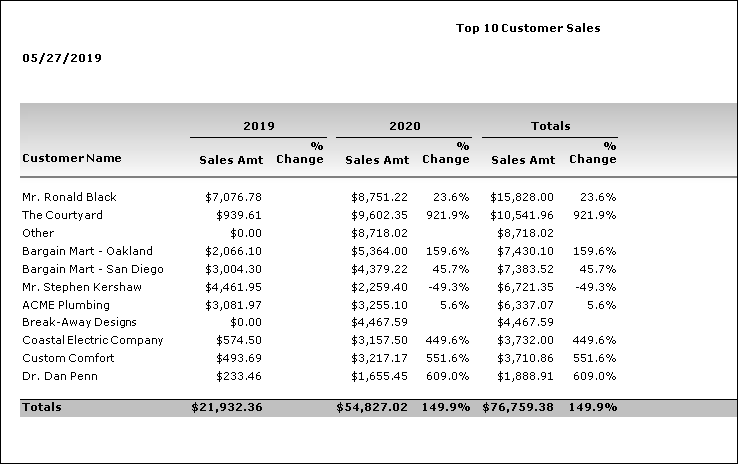
Top 10 Customer Sales.sfx: This report shows a comparison of sales for the top 10 customers, and shows how a top report can show records that aren't in the top group as "Other".
Other Reports
Exclude Filter Example.sfx: using an exclude filter, show all of the customers who haven't ordered anything this year.
Find Customer in Google Maps.sfx: locate a customer in Google Maps.
© Stonefield Software Inc., 2025 • Updated: 05/03/24
Comment or report problem with topic