 Field Properties (Cross-Tab Report)
The Properties dialog allows you to specify how the field appears in the report. You can display this dialog for the highlighted field by clicking the Properties button in Step 3 of the Cross-Tabulation Report Wizard, double-clicking the field, or selecting the field and pressing Enter.
The options in the Display page of this dialog vary by field location. The following options are available for row and page fields except where noted:
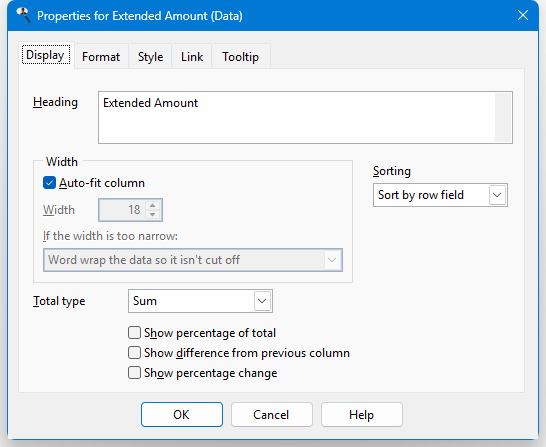
Heading: displays the description used for the field's heading; the default heading is the field's caption, unless you select a non-numeric field for a data field, in which case the default heading is "Count." You can specify multiple lines for the heading by pressing Enter where a new line should start.
Width: if the Auto-fit column option is turned off, this is used as the width for the field in the report. The default is the larger of the field width and the width of the column heading. This value can be reduced to fit more columns on the page; the field contents and column heading either automatically wrap within the reduced width as necessary or are cut off if the contents are too wide for the reduced width, depending on the setting of the If the width is too narrow option (discussed next).
Setting Width to 0 for a row field prevents that field from being displayed in the report.
If the width is too narrow: this setting determines whether the contents of a field that are wider than the setting of the Width option automatically wrap within the column width (the default) or are cut off. There are two choices for the latter: you can specify that an ellipsis appears at the end of the text (for example, "Bob Jones Country Store" may appear as "Bob Jones...") or in the middle of the text (for example, "Bob Jones Country Store" may appear as "Bob...Store"), making it obvious that some data isn't displayed.
Subtotal on this field: this option, which is only available for row fields, is only available if there is more than one row field, the selected field isn't the last row field, and the next row field doesn't have Total type set to Sum. If this option is turned on, Stonefield Query subtotals this field, showing the totals of the lower level row field records. The Place subtotals above details setting in the Formatting Options step allows you to specify where the subtotals appear.
Suppress repeating values: if this option is turned on (which it is by default) and several records in a row have the same value in this field, only the first occurrence is printed; the field in subsequent records appears blank. This option isn't available for page fields.
Start each group on a new page: if this option is turned on, Stonefield Query performs a page break when the content of this field changes. Note that this option is only available for the first row field when there is more than one row field and only when Subtotal on this field is turned on. This option isn't available for page fields since page fields always start a new page.
Total type: this option allows you to sum on this field. The sum appears at each subtotal level as well as in the column totals row. This option is only available for numeric row fields. Turning this option on turns off Subtotal on this field and disables it for the previous row field.
The following options are available for column fields:
Display date as: this option, which is only available for date fields, allows you to specify whether the actual date is displayed ("Date") or whether the results are summarized by hour, day, week, month, month and year (with either the full month name or as a three-letter abbreviation, such as "Jan" for "January"), quarter, year, or fiscal year. Choose the desired function from the drop-down list.
If you choose "Week," the Week starts on setting in the Options dialog determines which day a week starts on. If you choose "Quarter" or "Fiscal Year," the Year starts in setting determines which quarter number or year a date falls in.
Rotate column headings: turn this option on if you want headings for the columns to be rotated 90 degrees. This is useful if the column headings are wider than the data in the columns and you want to fit more columns on each page. This option is only available if there's just one data field and its Show percentage of total option is turned off.
The following options are available for data fields:
Heading: displays the description used for the field's heading; the default heading is the field's caption, unless you select a non-numeric field for a data field, in which case the default heading is "Count." You can specify multiple lines for the heading by pressing Enter where a new line should start. This option is ignored for data fields unless you have selected more than one data field.
Auto-fit column: if this option is turned on, which it is by default, the column is automatically sized to accommodate the widest value in the column, including the column heading. This option isn't available for column fields, since the setting for data fields determines the width.
Width: if the Auto-fit column option is turned off, this is used as the width for the field in the report. The default is the larger of the field width and the width of the column heading. This value can be reduced to fit more columns on the page; the field contents and column heading either automatically wrap within the reduced width as necessary or are cut off if the contents are too wide for the reduced width, depending on the setting of the If the width is too narrow option (discussed next).
If the width is too narrow: this setting determines whether the contents of a field that are wider than the setting of the Width option automatically wrap within the column width (the default) or are cut off. There are two choices for the latter: you can specify that an ellipsis appears at the end of the text (for example, "Bob Jones Country Store" may appear as "Bob Jones...") or in the middle of the text (for example, "Bob Jones Country Store" may appear as "Bob...Store"), making it obvious that some data isn't displayed.
Total type: this option allows you to specify whether a total ("sum"), count, count distinct, average, highest, or lowest value appears for this field. The difference between Count and Count Distinct is that Count counts the number of records while Count Distinct counts the number of records having unique values on this field. For example, if there are 100 order records but all orders were placed this week, using Count on the Order Date field would display 100 but Count Distinct would display 7 (assuming at least one order was placed every day this week). Note that only one field in a report can use Count Distinct. Choose the desired function from the drop-down list.
Show percentage of total: turn this option on to show the percentage that each value is of the total. The Show percentage for columns option in Step 5 determines whether the percentage is based on the row total (the default) or column total; this option isn't in the Field Properties dialog because it affects every field with Show percentage of total turned on. This option is only available when Total type is set to Sum, Count, or Count Distinct.
Show difference from previous column: turn this option on to show the amount difference between a column and the previous column. Note that if you turn this option on, you can't print or preview the report if it has more columns that can fit on one horizontal page, although you can still output it to Microsoft Excel, delimited, or PivotTable files. This option is only available when Total type is set to Sum, Count, or Count Distinct.
Show percentage change: this option is similar to Show difference from previous column but shows the percentage difference between the two columns.
Sorting: this setting determines how the report is sorted. The default is Sort by row field, meaning the report is sorted in ascending order on the row field. However, you can choose Ascending order or Descending order to sort in the desired order on this data field.
The options in the Format page of this dialog are:
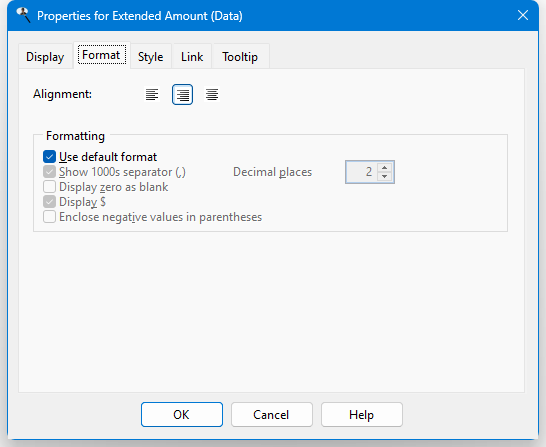
Alignment: text alignment options for field headings and field contents. By default, numeric fields are right-aligned and all others are left-aligned. This option is only available for row fields; column and data fields are automatically right-aligned.
Use default format: if this option is turned on, which it is by default, Stonefield Query uses the defined format for the field. If the format for the field changes in the future, the report uses the new format automatically. If you wish to change any of the formatting options, turn this setting off. This option is only available for numeric fields.
Show 1000s separator: this option is only available for numeric fields or, for data fields, if the Total type option is set to Count. If this option is turned on, the values in the field are formatted with the thousands separator defined in the Regional Settings applet of the Windows Control Panel.
Display zero as blank: if this option is turned on, a blank is displayed rather than a zero value. This option is only available for numeric fields or, for data fields, if the Total type option is set to Count.
Display $ (the appropriate currency symbol for your system is displayed in place of "$"): turning this option on displays the currency symbol defined in the Regional Settings applet of the Windows Control Panel in front of the field's value. This option is only available for numeric fields.
Enclose negative values in parentheses: turn this option on to display negative numbers in parentheses rather than with a minus sign; for example, (123.45) instead of -123.45. This option is only available for numeric values and only if Summary is not set to Count or Count Distinct.
Display empty date as blank: if this option is turned on, a blank is displayed rather than " / / " for blank dates. This option is only available for date/time fields.
Display date only: turning this option on displays only the date portion of the field's value. This option is only available for date/time fields.
Decimal places: the number of decimals to display for numeric fields.
Display date as: this option, which is only available for date fields that appear in rows, allows you to specify whether the actual date is displayed ("Date") or whether the results are summarized by hour, week, month, quarter, or year. Choose the desired function from the drop-down list. Note that if you choose "Week," the Week starts on setting in the Options dialog determines which day a week starts on.
The options in the Style page of this dialog are:
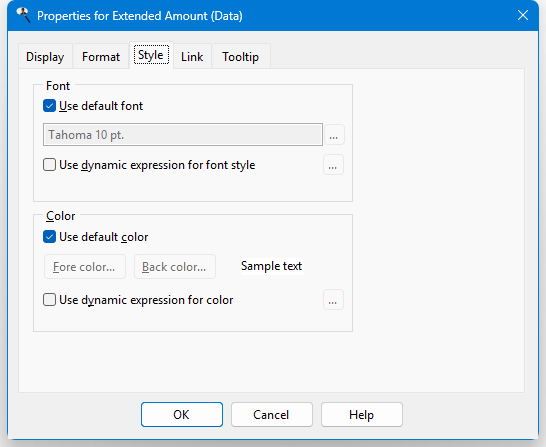
Use default font: if this option is turned on, which it is by default, this field uses the default font specified in the template for the report, even if the default font is changed after the field is added to the report. To change the font, turn this option off.
Font: the font name, size, and style to use for this field. To change any of these, click the font selection button (which appears as "...") and select the desired font name, size, and style from the Font dialog that appears. Note that if you select a font script other than Western, the script name (such as "Greek") appears after the font name, size, and style.
Use dynamic expression for font style: if you want the font name, size, or style of the field to change depending on the contents of this or some other field, turn this setting on and click the button with the ellipsis ("..."). The following dialog appears:
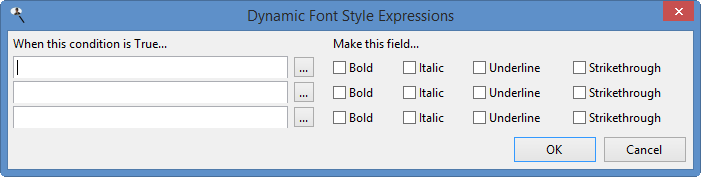
In this dialog, enter the expression you wish to look for (you can click the Expression Builder button to launch the Expression Builder, which makes it easier to enter the expression) and the font style to use when that expression is true. You can use "{VALUE}" as a placeholder for the value of the current field being output rather than specifying the field name. You can enter up to three expressions to change the font style. If none of the expressions is true, the font style specified for the field is used.
Using this option significantly increases report generation time, so use it only when required.
The expression is evaluated against the result set, which means that you may have to account for formatted values. For example, formatting a date field to display as Month/Year causes that field to contain values such as "January 2021," which is a string rather than a date, in the result set. That means an expression like "YEAR({VALUE})" is invalid because the YEAR() function requires a date parameter.
If your dynamic expression is invalid, you won't get an error; it'll simply be ignored.
Use default color: if this option is turned on, which it is by default, this field uses the default color specified in the template for the report, even if the default color is changed after the field is added to the report. To change the color, turn this option off.
Fore color: the foreground, or text, color for the contents of the field. The default color is the color used in the template for the report; to change it, click this button and select the color from the Color dialog that appears. The sample text show what the field looks like in the report.
Back color: the background color for the field. The default color is the color used in the template for the report; to change it, click this button and select the color from the Color dialog that appears. The sample text show what the field looks like in the report.
Use dynamic expression for color: if you want the color of the field to change depending on the contents of this or some other field, turn this setting on and click the button with the ellipsis. The following dialog appears:
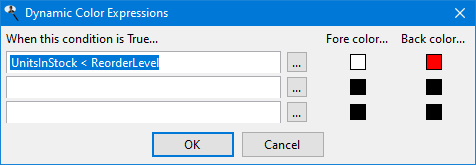
In this dialog, enter the expression you wish to look for (you can click the Expression Builder button to launch the Expression Builder, which makes it easier to enter the expression) and the foreground (text) and background colors to use when that expression is true. For example, in the image above, when UnitsInStock is less than ReorderLevel (in other words, we need to reorder this product), the field appears in white text on a red background. You can use "{VALUE}" as a placeholder for the value of the current field being output rather than specifying the field name. You can enter up to three expressions to change the color. If none of the expressions is true, the color specified for the field is used.
Using this option significantly increases report generation time, so use it only when required.
The expression is evaluated against the result set, which means that you may have to account for formatted values. For example, formatting a date field to display as Month/Year causes that field to contain values such as "January 2021," which is a string rather than a date, in the result set. That means an expression like "YEAR({VALUE})" is invalid because the YEAR() function requires a date parameter.
If your dynamic expression is invalid, you won't get an error; it'll simply be ignored.
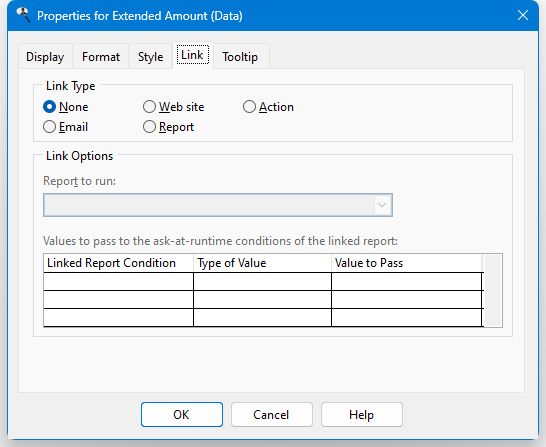
The Link page allows you to link the selected field to an email dialog, a Web site, a report, or Google Maps. A linked field appears underlined in the report Preview window, similar to a hyperlink in a Web browser, in either blue (for email and Web site links) or green (for report links). When you click a linked field in the Preview window, one of several things happens:
For email links, the New Message dialog for your email program is brought up with the email address already filled in.
For Web site links, your Web browser opens and navigates to the Web site.
For report links, the specified report is run and displayed in either another tab in the Preview window or its own Preview window, depending on the setting of the Preview reports in tabbed pages option in the Options dialog. This acts like drilling down from one report to another.
For Google Maps, your Web browser opens, navigates to the Google Maps Web site, and displays a map with the location of the selected company shown as a pushpin.
Most of the options on this page are disabled unless you set Link Type to something either than None.
The options in this page are:
Link Type: choose the desired link type.
Field containing email address: this option, which only appears if Link Type is set to Email, specifies which field contains the email address to link to. By default, it's the same as the field the properties dialog is working on, but if, for example, you wish to click on the company name to bring up the New Message dialog with the proper email address filled in, select the field that contains the email address to link to. Only fields selected for the report appear in the list of fields, so be sure to include the desired field in the report. If you don't want that field to actually appear in the report, turn off the Display this field in the report setting for that field.
Field containing URL: this option, which only appears if Link Type is set to Web site, specifies which field contains the URL, or Web site address, to link to. By default, it's the same as the field the properties dialog is working on, but if, for example, you wish to click on the company name to bring up the Web site for that company, select the field that contains the URL to link to. Only fields selected for the report appear in the list of fields, so be sure to include the desired field in the report. If you don't want that field to actually appear in the report, turn off the Display this field in the report setting for that field.
Action to take: Google Maps is the only action currently supported, so selecting Action for the link type automatically selects Google Maps. Note that selecting this adds several fields necessary for mapping (address, city, state/province, and zip/postal code) to the report. Any fields that weren't already in the report have Display this field in the report turned off so they are retrieved from the database but don't appear in the report. You can, of course, turn Display this field in the report on if you wish to display them.
Report to run: this option, which only appears if Link Type is set to Report, specifies which report to run when you click the field in the Preview window. Click the down arrow and select the report from the list; you have to expand the folder the desired report is in to select the report. When you've found the desired report, double-click it or select it and click the down arrow to close the report selector.
Values to pass: this option, which is only available if Link Type is set to Report, allows you to pass values to the ask-at-runtime filter conditions of the linked report. Without this option, when you click a field linked to another report, that report will prompt you for any of its ask-at-runtime filter conditions, which may not make sense. For example, suppose you have a customer report and you've linked the company name field to a report showing sales by customer. The linked report has an ask-at-runtime filter condition on the customer number, so when you click a particular company name, the linked report runs and asks you for the customer number. That seems odd, because you just clicked a particular customer and now it wants you to specify which customer. To make this more seamless, you want to tell the linked report which customer you just clicked. You do that by specifying what value to pass to the ask-at-runtime filter condition of the linked report. In this case, you'd specify that the customer number should be passed to the linked report. Since that value is passed, the report doesn't need to ask you for the customer number, and simply displays the sales for the customer you clicked.
The list shows each of the ask-at-runtime conditions for the linked report. The first column shows the field used in the ask-at-runtime condition, the second column allows you to specify the type of value to pass to the report, and the third column specifies the value to pass. The choices for the Type of Value column are:
None, which means a value won't be passed to this condition, so you'll still be prompted for its value.
Filter Condition, which means this report contains the same ask-at-runtime filter condition as the linked report, and you want the value you specify when you run this report passed to the linked report. For example, if both reports have an ask-at-runtime filter condition on the order date, you'd want to use the same order date range you specify when you run this report used for the linked report. So, choose Filter Condition and select the field used for the condition in the Value to Pass column.
Field, which means you want to pass the value of the field specified in the Value to Pass column for the current record. For example, when you click the company name, you want to pass the customer number to the ask-at-runtime filter condition on customer number to the linked report, so choose Field and select the Customer Number field in the Value to Pass column.
Ignore this condition, which means you want to ignore this condition (that is, act like you clicked the Ignore this condition option in the filter value dialog) and not display the dialog asking you for the value for this condition.
Only fields in the row, column, or data area appear in the list of fields in the Value to Pass column. Fields in the Available fields list don't actually appear in the report so you cannot pass them to the linked report.
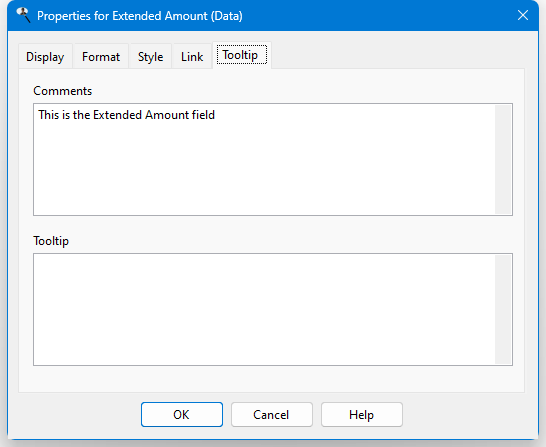
The Tooltip page shows any comments about the field, which is often used to provide a description of the field's contents, and allows you to enter a tooltip for the field. The tooltip appears when you hover the mouse pointer over a value for that field in the Preview window, in a PDF file, and in a HTML file. To use an expression for the tooltip, surround it with curly braces. For example, if you have a report showing Customer Name and City, and the report also has Country but with Display this field in the report turned off, using an expression of:
{Country}
will display the country name when you hover over a city.
© Stonefield Software Inc., 2025 • Updated: 03/27/24
Comment or report problem with topic