 Creating a Report
You can create reports as long as you have a license other than Basic or Report Viewer.
To create a new report, do one of the following:
If the toolbar is displayed at the top of the Reports Explorer, click the New button and choose the desired report type from the Reports Types dialog.
Click the down arrow to the right of the New button in the toolbar or in the Home tab of the ribbon and choose the desired report type from the dropdown list that appears.
Choose New Report from the File menu (if the menu is displayed); this also displays the Reports Types dialog.
Right-click anywhere in the Reports Explorer and choose New Report from the shortcut menu to display the Reports Types dialog.
Press the Insert key; this also displays the Reports Types dialog.
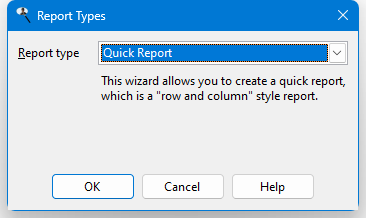
Seven types of reports are available:
Quick report: a "row and column" style report. This is the most common type of report in Stonefield Query.
Cross-tabulation report: a cross-tabulation (or "cross-tab") report, which is similar to a PivotTable in Microsoft Excel and is used for data analysis.
Label report: use for mailing or other types of labels.
Chart report: creates charts from your data, including bar and pie charts.
Gauge report: creates gauges from your data.
Dashboard: displays one or more charts in a separate window and automatically refreshes them at an interval you decide.
Batch report: runs two or more reports, one after the other.
External report: a report created in another application added to the Reports Explorer so you can easily run it.
© Stonefield Software Inc., 2025 • Updated: 01/20/21
Comment or report problem with topic