 Reporting on Usage Statistics
Stonefield Query maintains usage statistics for reports, including who ran a report when and with what database. The Usage Reporting function in the Tools menu and the Tools tab of the ribbon allows you to report on these statistics. This allows you to determine which reports are actually being used, how often, and by whom.
You must have an Ultimate license to report on usage statistics.
When you select the Usage Reporting function, another instance of Stonefield Query runs, displaying "Usage Reporting" in the title bar. Like the normal program, you can create reports, preview or print them, output them to file, and so on. However, this version only reports on the usage statistics, not on your database. When you create a report, you only see two tables: Usage and Reports. Usage has the following fields:
Report Name: the name of the report.
Report Type: the type of report: Quick, Cross-tab, Label, Chart, Gauge, or Dashboard.
Folder: the folder the report is in.
Database: the database the user ran the report against.
Run By: the name of the user who ran the report.
Run At: the date and time the report was run.
Reports has the following fields:
Comments: the comments for the report.
Created By: the name of the user who created the report.
Created At: the date and time the report was created.
Modified By: the name of the user who last modified the report.
Modified At: the date and time the report was last modified.
Summary: True if the report is a summary report.
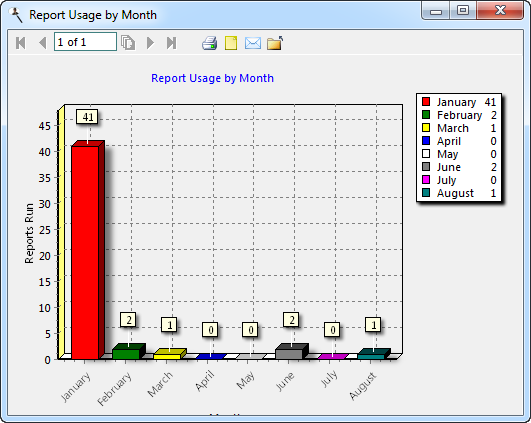
You can create any type of report you wish. For example, here's a chart showing how many times reports were run by month:
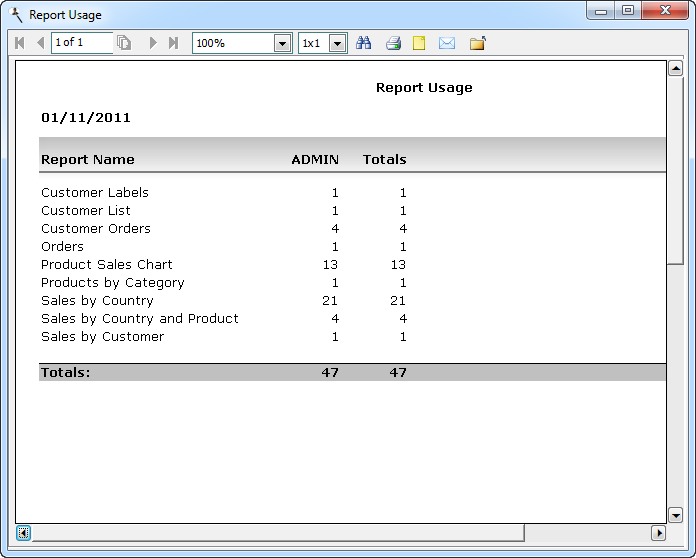
This cross-tab report shows how many times each user ran each report:
If you want to turn off usage tracking, turn off the Support usage tracking setting in the Options dialog.
© Stonefield Software Inc., 2026 • Updated: 02/01/21
Comment or report problem with topic