 Step 5: Formatting Options (Cross-Tab Report)
Step 5 allows you to specify certain options for the report.
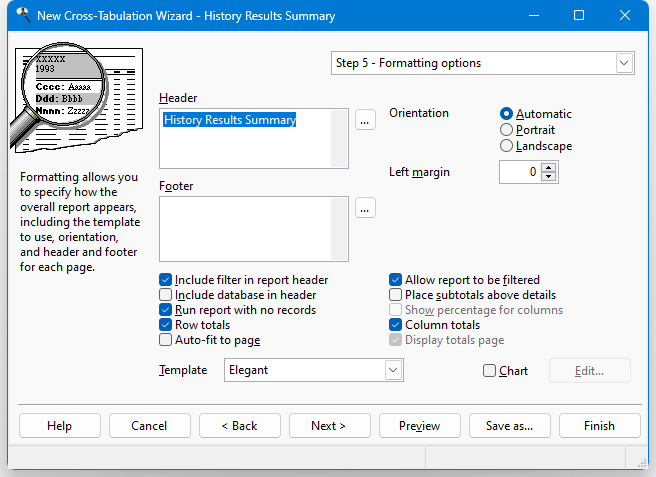
The options in this step are:
Header: text that appears at the top of every page. If you want to use an expression rather than fixed text, such as a user-defined function, add "{" and "}" (without the quotes) around field or function names in the text. You can also click the Expression Builder button (the button labeled "..." beside the text box) to display the Expression Builder, which is a much easier way to create the expression to use.
Here's an example of an expression that displays "Sales for <spelled out month> <year>" (such as "Sales for December 2001") in the report header:
Sales for {cmonth(date())} {year(date())}Here's an expression that uses the built-in GetConditionValue function, which returns the value of a filter condition for the specified field, to display a header showing "Sales for " a particular country the report is filtered on:
Sales for {GetConditionValue('customers.country')}Expressions can even include fields from the result set for the report.
Footer: text that appears at the bottom of every page. As with the header, you can use an expression for the report footer; click the Expression Builder button to display the Expression Builder, which is a much easier way to create the expression to use.
Orientation: The default choice, "Automatic," means that if the report is too wide to fit in portrait orientation, it automatically switches to landscape. However, you can override this by choosing either "Portrait" or "Landscape" to force the report to be printed in the desired orientation.
Left margin: how many characters to indent the entire report; this is handy if, for example, you want to print a report and punch holes in it so it can be inserted into a binder.
Include filter in report header: if this option is turned on, any filter you've set for the report is displayed in the header of the report.
Include database in header: turn this option on to include the database name in the header of the report.
Run report with no records: turn this option on (the default) to run the report even when there are no records that match your filter condition. This results in a blank report. If this option is turned off, rather than displaying a blank report, Reporting4Act! displays a message that there are no records.
Row totals: turn this option on to display totals for each row.
Auto-fit to page: this option adjusts the columns so they fit the width of the page. It does this one of two ways:
If there are a lot of column values in the report, there may be more than one horizontal page for each row. If you turn this option on, it automatically reduces the font as necessary (down to 6 points) in an attempt to fit the columns onto one page. Of course, it's still possible they won't fit on one page, depending on how many column values there are, how many data fields you've chosen, the paper width, the orientation, the font, and the font size. In that case, the font is unchanged.
If there aren't many column values for the report, Reporting4Act! adds extra space between the columns so the columns are spread evenly across the page to take up the entire width of the page.
Allow report to be filtered: turn this option on if someone can specify a filter for the report in the Reports Explorer. This should normally be turned on, but if you specify a filter in Step 5, you may wish to turn this off.
Place subtotals above details: Reporting4Act! normally places subtotals for row fields below any sub-row, or detail, fields in a "subtotal" row, as shown below:
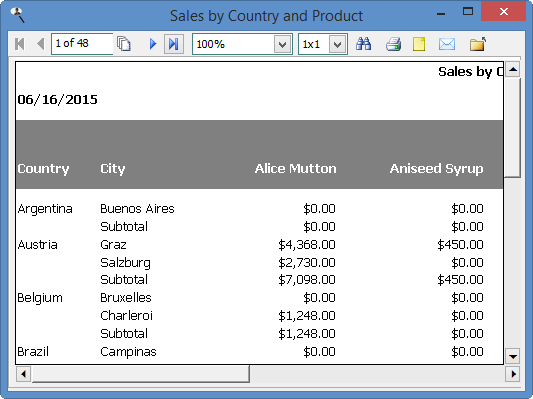
If you want subtotals to appear in the same row as the row field, so they appear above sub-row fields, turn the Place subtotals above details option on.
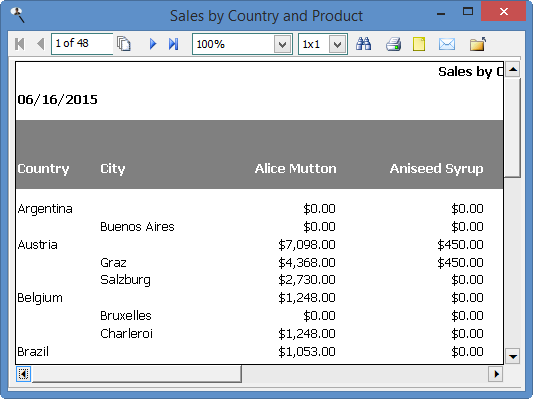
Note that this option is disabled if Start each group on a new page is turned on for the first row field in the Field Properties dialog, since those two settings can't be used together.
Show percentage for columns: by default, any data field that has the Show percentage of total option in the Field Properties dialog turned on displays each value as a percentage of the row total. Turn Show percentage for columns on if you want the percentages to be of the column totals instead.
Column totals: turn this option on to display totals for each column.
Display totals page: turn this option on to have a totals page at the end of the report summarizing the report. This option is only available when the report has a page field.
Template: this specifies the overall layout of the report. The default template for a new report is determined by the Default template setting in the Options dialog, but if other templates are available, you may select the desired one from the drop-down list. Templates are created and edited using the Template Editor.
Chart: if this option, which is only available if you have an Ultimate license, is turned on, you can add a chart to the report by clicking the Edit button beside this option and using the Chart Wizard.
Edit: click this button, which is only enabled if the "Chart" option is turned on, to display the Chart Wizard. The only two steps available in the Chart Wizard are Chart Layout and Formatting Options because the rest of the steps in the Chart Wizard are used for creating stand-alone charts.
© Keystroke.ca, 2025 • Updated: 04/16/21
Comment or report problem with topic