 Step 5: Formatting Options (Quick Report)
Step 5 allows you to specify formatting options for the report.
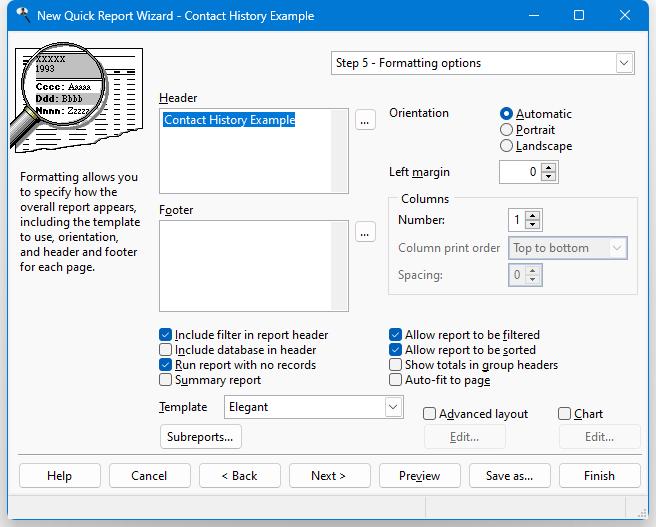
The options in this step are:
Header: text that appears at the top of every page. If you want to use an expression rather than fixed text, such as a user-defined function, add "{" and "}" (without the quotes) around field or function names in the text. You can also click the Expression Builder button (the button labeled "..." beside the text box) to display the Expression Builder, which is a much easier way to create the expression to use.
Here's an example of an expression that displays "Sales for <spelled out month> <year>" (such as "Sales for December 2001") in the report header:
Sales for {cmonth(date())} {year(date())}Here's an expression that uses the built-in GetConditionValue function, which returns the value of a filter condition for the specified field, to display a header showing "Sales for " a particular country the report is filtered on:
Sales for {GetConditionValue('customers.country')}Expressions can even include fields from the result set for the report.
Footer: text that appears at the bottom of every page. As with the header, you can use an expression for the report footer; click the Expression Builder button to display the Expression Builder, which is a much easier way to create the expression to use.
Include filter in report header: if this option is turned on, any filter you've set for the report is displayed in the header of the report.
Include database in header: turn this option on to include the database name in the header of the report.
Run report with no records: turn this option on (the default) to run the report even when there are no records that match your filter condition. This results in a blank report. If this option is turned off, rather than displaying a blank report, Stonefield Query displays a message that there are no records.
Summary report: if this item is turned on, the report does not print detail information but only those fields that appear in group headers and totaled fields. This option is disabled unless there's at least one group in the report and for advanced layout reports. Note that sorting on totaled fields is given higher priority than grouped fields. This allows you to show, for example, sales by product with the biggest selling items first by using a descending sort on the sales amount field.
You are warned if you run a summary report with fields that won't appear because they aren't grouped or summed. The report still runs if you allow it.
Template: this specifies the overall layout of the report. The default template for a new report is determined by the Default template setting in the Options dialog, but if other templates are available, you may select the desired one from the drop-down list. Templates are created and edited using the Template Editor.
Subreports: click this button, which is only available if you have an Ultimate license, to display the Subreports Wizard. This wizard allows you to add subreports to the report. A subreport is a report that displays inside another one. For each record in the main report, a subreport shows related records. If a subreport has an ask-at-runtime filter condition that matches a filter condition in the main report, the value of that filter condition for the main report is used for the subreport rather than prompting you for the value (similar to the way this works for linked reports).
Here's an example of a report with a couple of subreports:
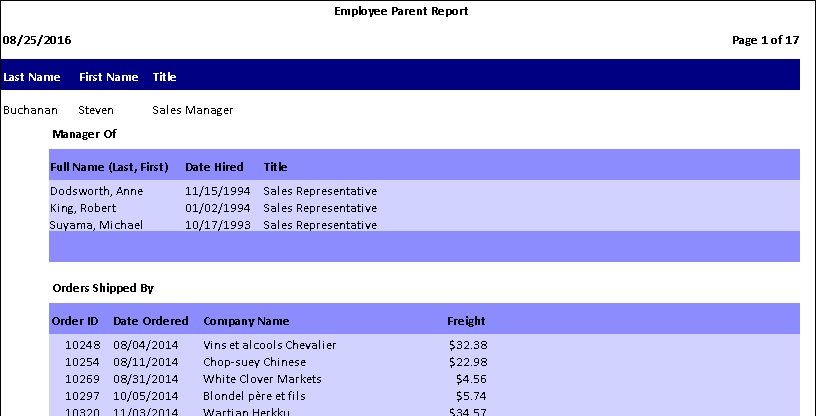
The main report shows the last name, first name, and title of employees. For each one, the Manager Of subreport show which employees this employee manages and the Orders Shipped By subreport shows which orders this employee shipped.
Reports containing subreports can output to file, but outputting to Microsoft Excel - Data Format, Table, and XML outputs only the data for the main report, not the subreports. Nested subreports aren't supported; that is, a subreport can't contain subreports. Grouping is ignored in subreports. Some templates work better with subreports than others: Standard, Standard - 8 pt, Elegant, and the various Stylish templates are the best choices, or of course you can edit others or create your own templates to support subreports.
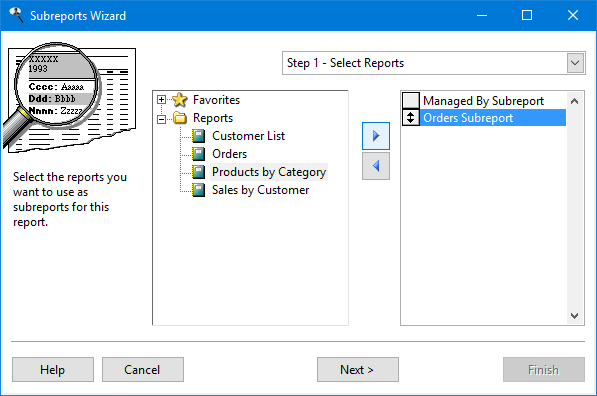
In the first step of the subreport wizard, select the reports you want to use as subreports of the current one. Note that a subreport must have something in common with the current report that's used to link the two. For example, both must have a customer ID or an order ID.
After selecting the subreports you want to use, you can rearrange the order in which they appear when the report is run by clicking the button in front of the desired report and dragging the button up or down in the list.
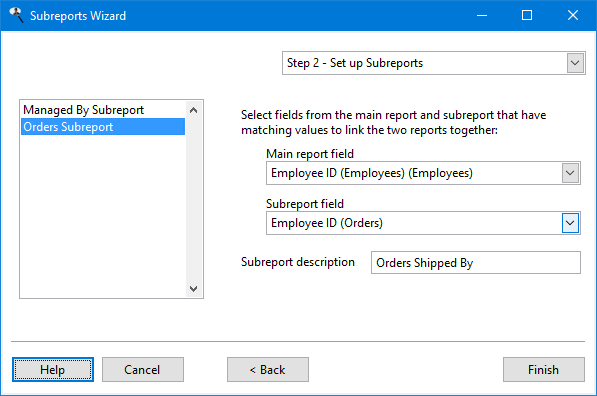
In the second step, you specify for each subreport which field in the main report links to which field in the subreport. For example, the customer ID in the main report might link to the customer ID in each subreport. You can also specify a subreport description; this is displayed as a header for the subreport when the report is run.
Click Finish to save the subreports.
Orientation: the default choice, "Automatic," means that if the report is too wide to fit in portrait orientation, it automatically switches to landscape. However, you can override this by choosing either "Portrait" or "Landscape" to force the report to be printed in the desired orientation.
Left margin: how many characters to indent the entire report; this is handy if, for example, you want to print a report and punch holes in it so it can be inserted into a binder.
Columns: normally all of the fields in a report are arranged across the page and one (or more) rows is used for each record. However, for reports that don't have many fields, it's useful to have the fields arranged in sets of columns, with the fields for the first set of records in one column, the fields for the next set to the right of the first column, and so on. The benefit of this is that rather than having the right side of the page empty, another column of records can be output there so the report takes fewer pages.
Summary band items, such as grand totals, appear on their own page if anything is output into any but the leftmost column on the last page of the report.
Here is an example of a report using two columns in top-to-bottom order with spacing set to 2:
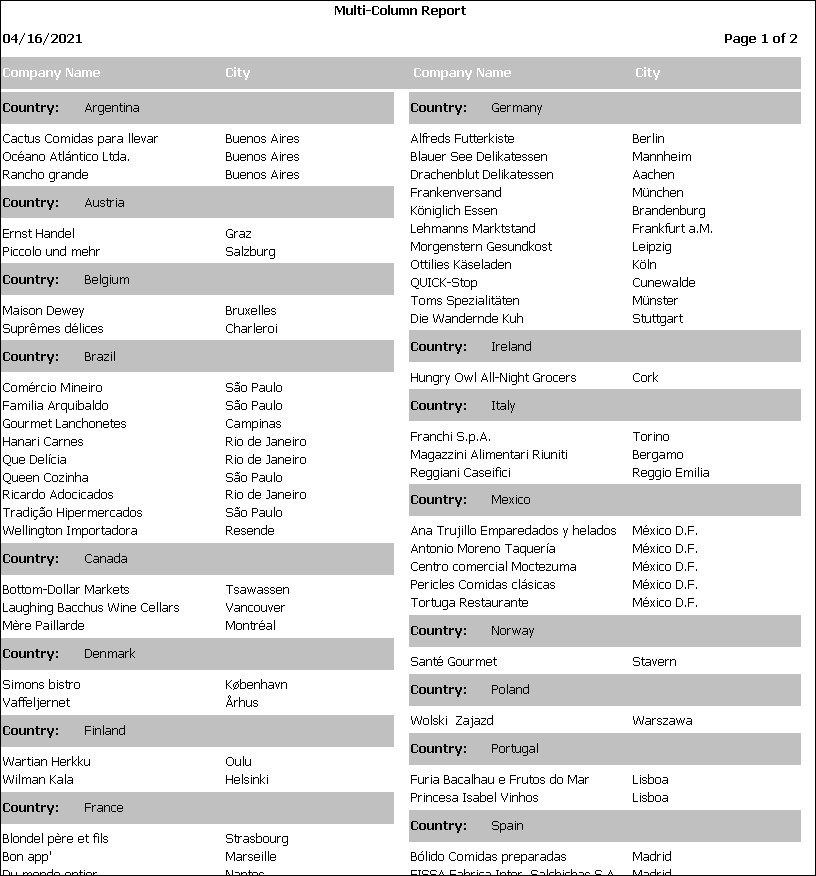
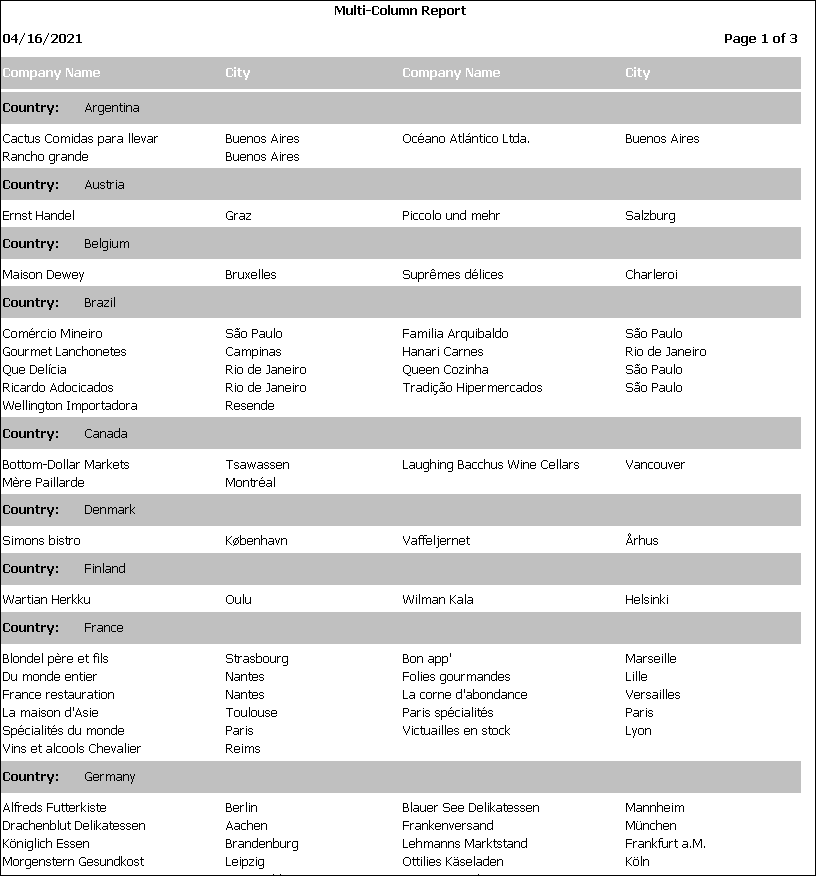
Notice the field headings ("Company Name" and "City") are repeated in each column. Here is the same report but using left-to-right order:
Number: specifies the number of columns to print across the page.
Column print order: specifies how records are printed when you have multiple columns: top-to-bottom or left-to-right. This setting is only available if there is more than one column.
Spacing: specifies the space between columns. This setting is only available if there is more than one column.
Allow report to be filtered: turn this option on if someone can specify a filter for the report in the Reports Explorer. This should normally be turned on, but if you specify a filter in Step 3, you may wish to turn this off.
Allow report to be sorted: turn this option on if someone can specify a sort order for the report in the Reports Explorer. If you group on any field, or specify a sort order in Step 4, you may want to turn this option off.
Show totals in group headers: if this option is turned on, group totals appear in the group header rather than the group footer. This option is disabled if there aren't any groups in the report or if any field has its Summary option set to "Count Distinct." If the report has an advanced layout and you want to change this setting, you'll have to do one of the following:
If the setting is currently off and you want to turn it on, you'll have to manually add the total to the group header band and remove it from the group footer band. Create a new field in the group header band and use this as its expression:
GetGroupCountOrTotal(1,'fieldname')where fieldname is the real name of the field (without the table name) being summed. For example:
GetGroupCountOrTotal(1,'TOTAL_PRICE')If the setting is currently on and you want to turn it off, you'll have to manually remove the total from the group header band and add it to the group footer band. Create a new field in group footer band and use the real name of the field (without the table name and not in quotes) being summed as the expression. In the Calculate page of the Field Properties dialog, set Calculation type to Sum and Reset based on to the field being grouped on.
Auto-fit to page: this option adjusts the fields so they fit the width of the page. It does this one of two ways:
If there are a lot of fields in the report, Stonefield Query normally moves fields to a second row when there are too many to fit on one. If you turn this option on, it automatically reduces the font as necessary (down to 6 points) in an attempt to fit the fields on one row. Of course, it's still possible they won't fit on one row, depending on how many fields you've chosen, the paper width, the orientation, the font, and the font size.
If there aren't many fields in the report, Stonefield Query adds extra space between the columns so the fields are spread evenly across the page to take up the entire width of the page.
This option is disabled for advanced layout reports.
Chart: if this option, which is only available if you have an Ultimate license, is turned on, you can add a chart to the report by clicking the Edit button beside this option and using the Chart Wizard. Note that if Advanced layout, described later, is turned on, you cannot turn this option on, although you can turn it off if you wish to remove the chart.
Edit: click this button, which is only enabled if the "Chart" option is turned on, to display the Chart Wizard. The only two steps available in the Chart Wizard are Chart Layout and Formatting Options because the rest of the steps in the Chart Wizard are used for creating stand-alone charts.
If you are defined as an advanced user in the Maintain Users and Groups dialog and you have an Ultimate license, two other options are available:
Advanced layout: if this option is turned on, this report's layout can be edited in the Advanced Report Designer. When this is turned on, you can no longer add or remove fields using the items in Step 2; you must add or remove them using the Advanced Report Designer instead. If this option is turned off for a report that has an advanced layout, any advanced layout for the report is discarded (you are asked to verify that you want to do this).
Edit: click this button, which is only enabled if the Advanced layout option is turned on, to display the Advanced Report Designer.
© Stonefield Software Inc., 2025 • Updated: 12/03/21
Comment or report problem with topic